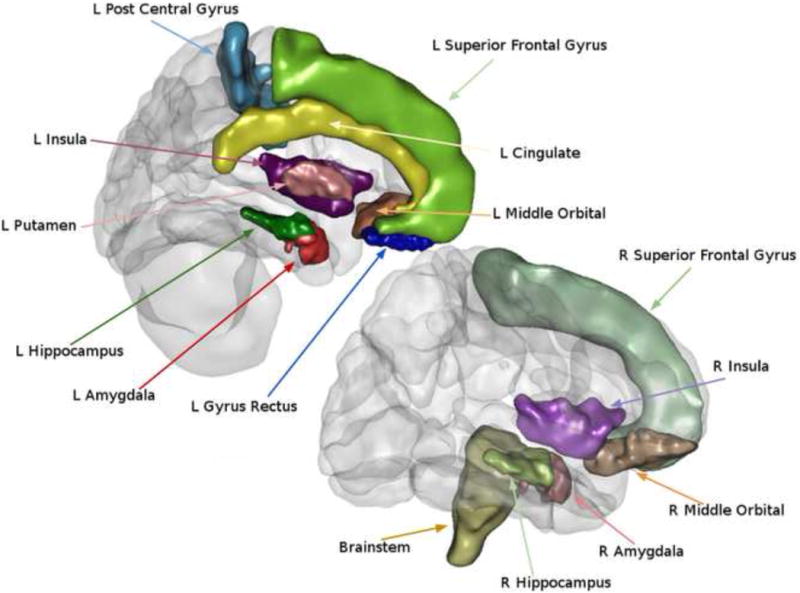
Figure 4.

Regions showing volumetric differences between healthy controls and irritable bowel syndrome patients.
The atlas-based ROIs that showed group differences are illustrated. ROIs were determined using the LONI probabilistic brain atlas (LBPA 40) and the Harvard-Oxford Atlas.
