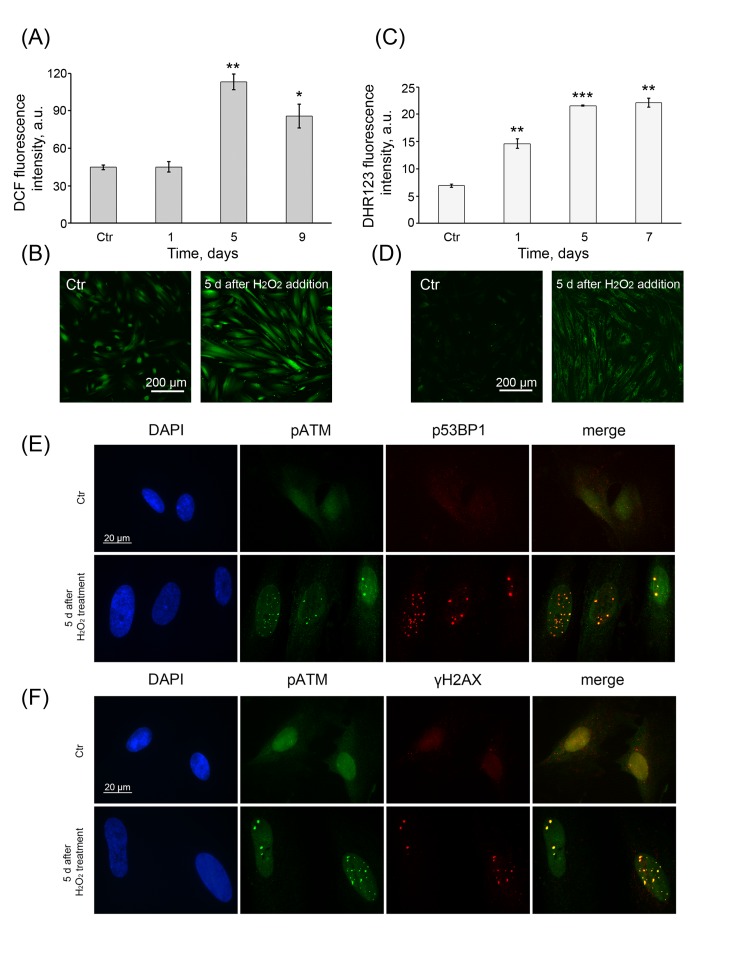
Figure 5. Permanent ROS generation and prolonged DDR activation.
(A) Intracellular ROS levels and (C) cellular peroxide levels detected at indicated time points by FACS analysis after staining with either DCF or DHR123, respectively. (M ± SD, N = 3, *p<0.05, **p<0.005, ***p<0.001, versus control). Representative DCF (B) or DHR123 (D) fluorescent images of control (Ctr) and treated hMESCs. Scale bar is 200 µm and valid for all images. (E) Co-localization of pATM with either p53BP1 or (F) γH2AX in 5 days after H2O2 treatment. DAPI was used as nuclear stain (blue). Representative photomicrographs of the staining are shown. Images are taken at magnification X100. Scale bar, 20 µm.

