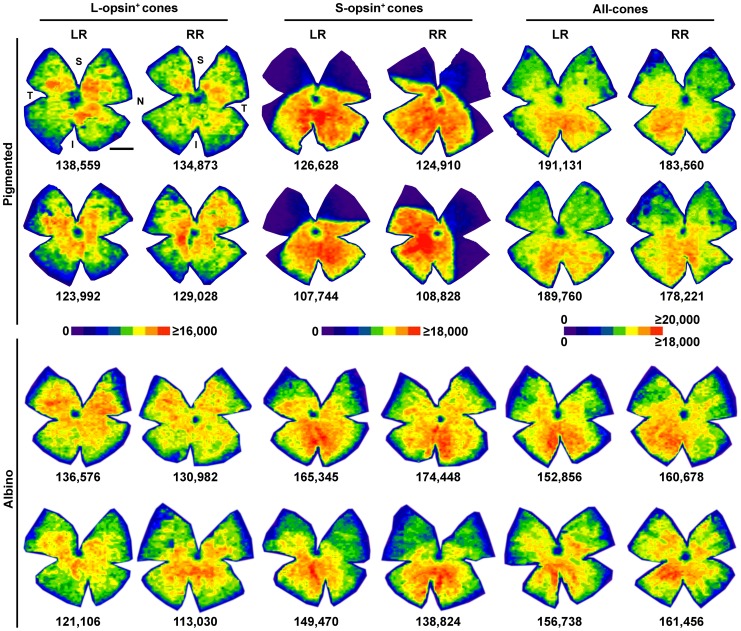
Figure 4. Cone distribution in the mouse retina.
Isodensity maps showing the topography of cones in pigmented and albino mice. For each population and strain two left and two right retinas are shown. Notice that because L-opsin+ and S-opsin+ cones were double immunodetected the first and third, and the second and fourth map in each row are from the same retinas. All-cones maps were generated from another set of retinas in which both α-opsin antibodies were visualized using secondary antibodies coupled with the same fluorophore, hence all cones were taken into account irrespectively of their opsin expression. Below each map is shown the number of cones quantified in its corresponding retina. The colour scale density code is placed in the middle of the figure. LR: left retina, RR: right retina. S: superior, N: nasal, I: inferior, T: temporal. Bar: 1 mm.

