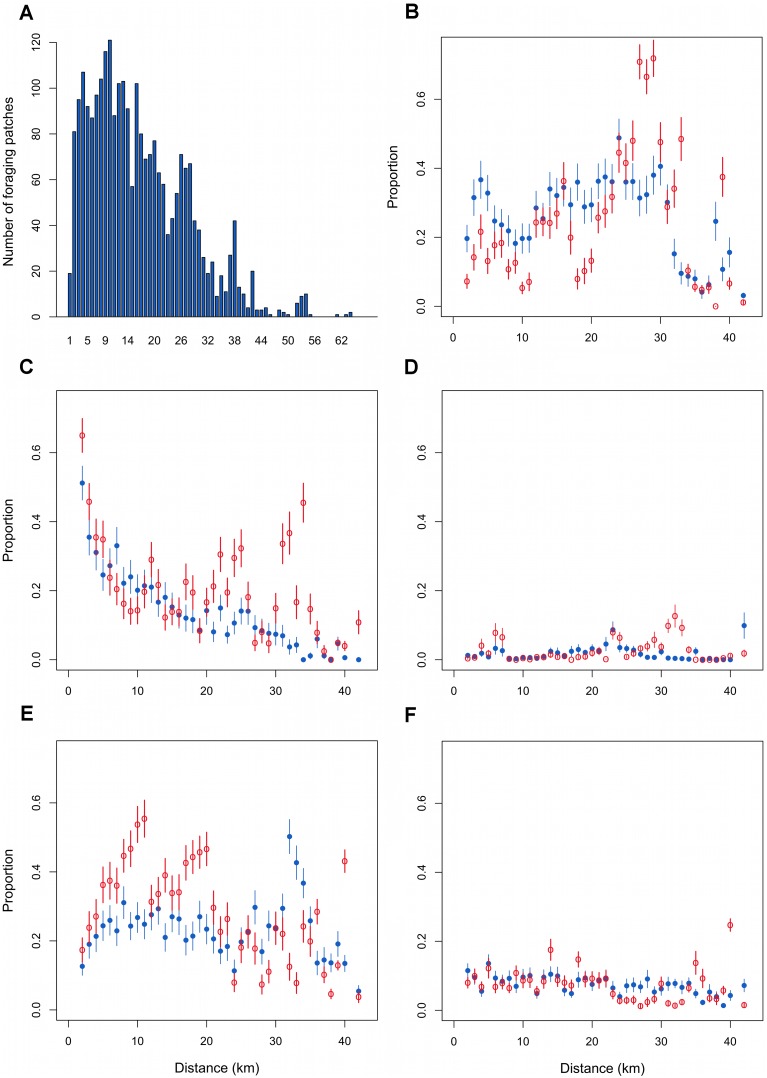
Figure 2. The effect of distance on habitat selection by foraging Ring-billed gulls.
Number of foraging patches within 1-km concentric bands from the colony (a). Mean (±1 SD) proportion of urban areas (b), waterbodies (c), lawns (d), intensive cultures (e), and extensive cultures (f) in foraging (blue) and movement patches (red) in relation with the distance from the colony.

