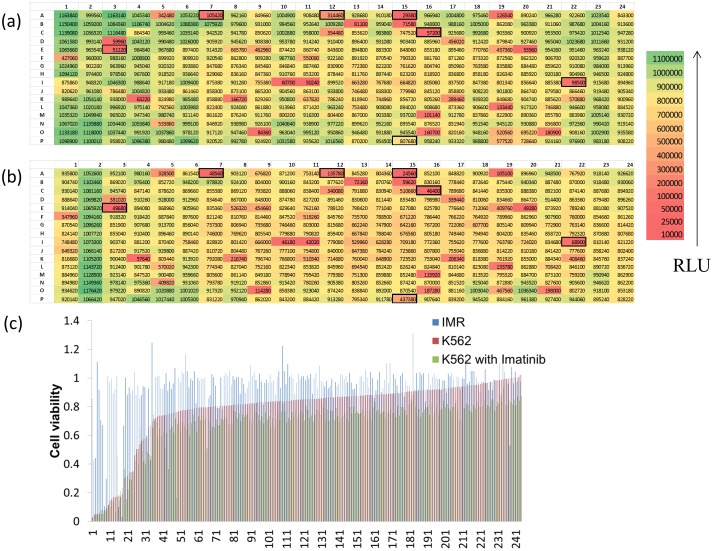
Figure 2. Selection of anti-leukemic drugs from kinase inhibitor library screens.
(a) A representative screening plate of a kinase inhibitor library consisting of 244 inhibitors. The ATP content of K562 cells (a measure of cell viability) was measured and the luminescence intensity of each well was color-coded according to the scale presented (RLU, relative luminescence unit). The corresponding compound ID in the plate map is shown in Table S1. (b) A representative screening plate of a kinase inhibitor library treated with 0.125 µM imatinib. The kinase inhibitors selected from the screens are indicated with black borders. (c) The kinase inhibitors are rank-ordered from the lowest to the highest cell viability in K562 cells without imatinib (red bars). The corresponding viability of IMR and K562 cells with imatinib are indicated using blue and green bars. Several drugs are selectively killing K562 cells.

