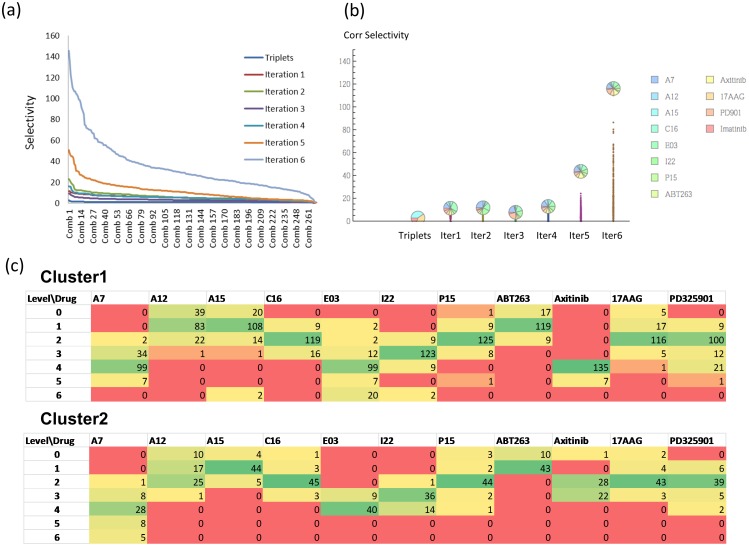
Figure 3. Iterative search for a highly selective drug combinations.
(a) Increased selectivity after each iteration step. The lines represent the selectivity of the drug combinations at as triplets and at each of the six iteration steps. (b) A dot plot showing corrected selectivity (see Results) through the iterative searches. The pie symbols shows the relative contributions of the 12 drugs for the best combination obtained at each iteration. (c) Cluster analysis on the optimized drug combinations. The top ranked 200 combinations clustered into two groups and the frequencies of the doses of the individual drugs are shown for each cluster.

