
Figure 6. Representative western blot analysis and relative densitometric quantification of AKT, eNOS and ERK.
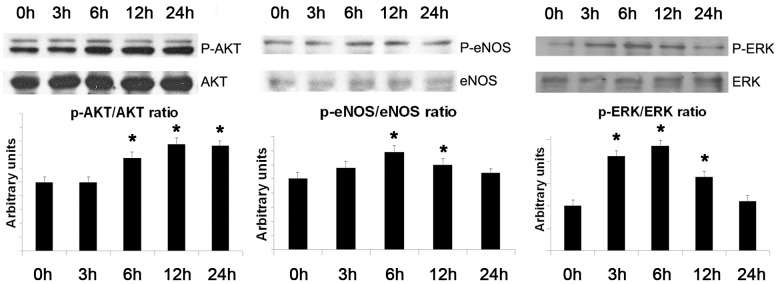
Results are expressed as ratio between phosphorylated (P-AKT, P-eNOS, P-ERK) and non-phosphorylated (AKT, eNOS, ERK) forms. Three different experiments were performed and data are expressed as mean ± SD. (*p<0.05 EVs at different time points vs. vehicle alone).