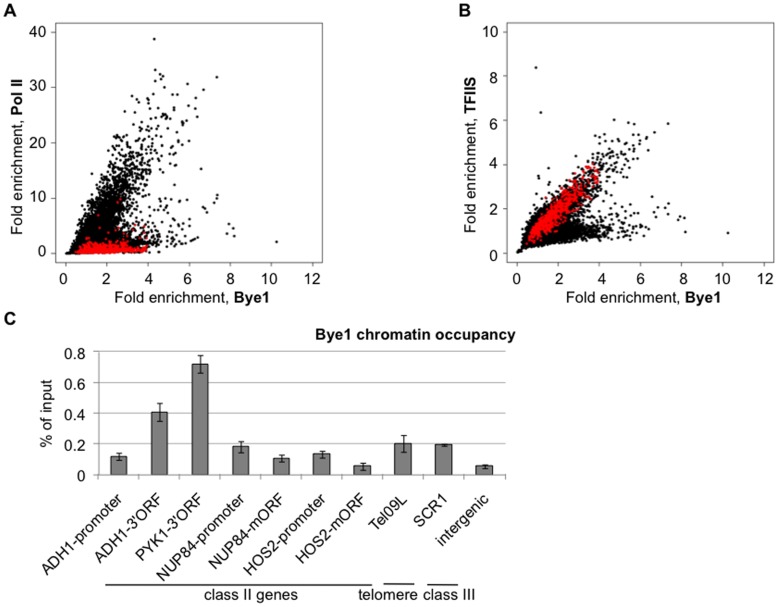
Figure 1. Analysis of Bye1, TFIIS and Pol II chromatin occupancies in yeast: (A, B) Genome-wide scatter-plots of Bye1 and Pol II distribution assessed by ChIP-chip in the Bye1-Myc HA-TFIIS strain.
Comparison of fold enrichment (A) between Pol II and Bye1 and (B) between TFIIS and Bye1. Red dots correspond to probes complementary to class III genes (listed in Table S7); (C) Quantification of Bye1 enrichment in coding regions of class II and class III genes, promoters of some class II genes and Y’-containing telomeric ends by ChIP. 3′ORF and mORF stand for the 3′end and middle coding regions.

