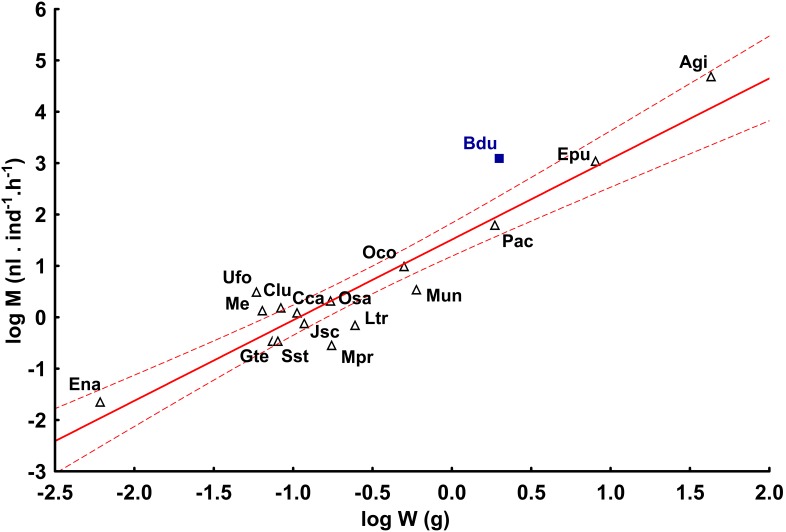
Figure 3. The relationship between individual methane production and the mean body mass.
Mean methane production (M) in methane-positive species of millipedes (accidental, obligatory, and facultative producers) plotted against mean body mass of species (W). Species abbreviations are indicated in Table S1. Methane production by the cockroach Blaptica dubia (Bdu) is included for comparison. Red lines = regression of M on W with 95% confidence intervals.

