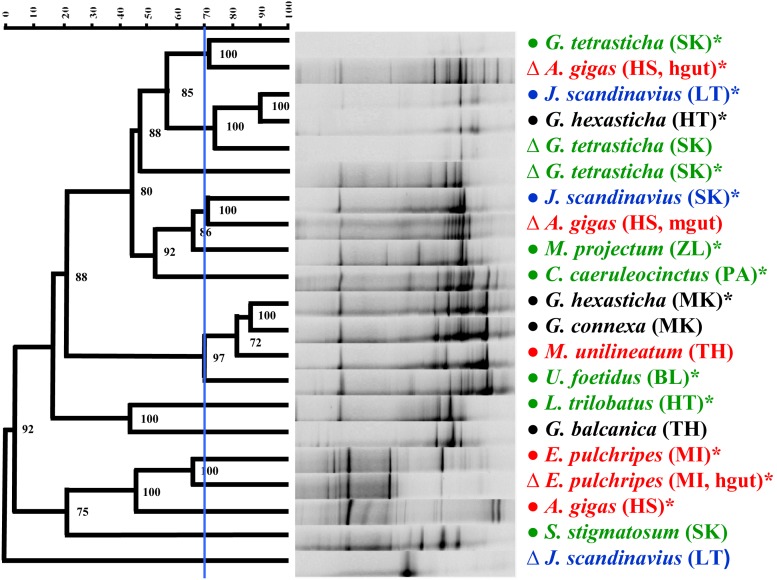
Figure 8. Cluster analysis of methanogenic communities in millipedes.
DGGE patterns were obtained after PCR amplification of the 16S rRNA gene of the methanogenic communities in the gut contents (Δ) or faecal pellets (•) of individual millipedes from the indicated species. Pearson correlation and UPGMA analysis were used. Abbreviations in brackets indicate the origin of animal samples (see Table S1). mgut = midgut and hgut = hindgut samples. Species belonging to different pre-defined groups of methane producers are marked with different colours: NP – black, AP – green, FP – blue, and OP – red. Asterisks indicate that the samples were from individuals or faecal pellets in which methane production was detected using gas chromatography. Blue line = similarity cutoff 70%.

