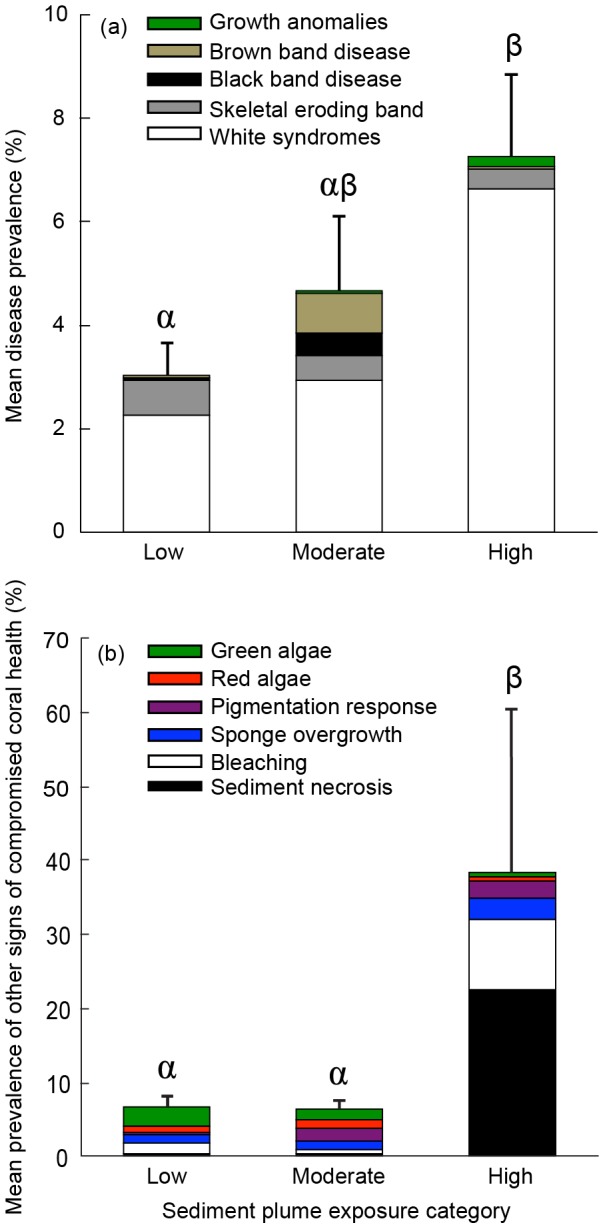
Figure 2. Mean prevalence of (a) coral disease and (b) other signs of compromised coral health at sites within three sediment plume exposure categories: low (0 to 9 plume exposure days; n = 18 transects), moderate (40 to 78 plume exposure days; n = 9 transects), and high (296 to 347 plume exposure days; n = 6 transects).

Stacked bars indicate disease or other compromised coral health indicator prevalence by category and error bars indicate standard error among transects for total prevalence of disease or other compromised coral health indicators. Letters indicate post-hoc groupings (Tukey's HSD, p<0.05) between sediment plume exposure categories.
