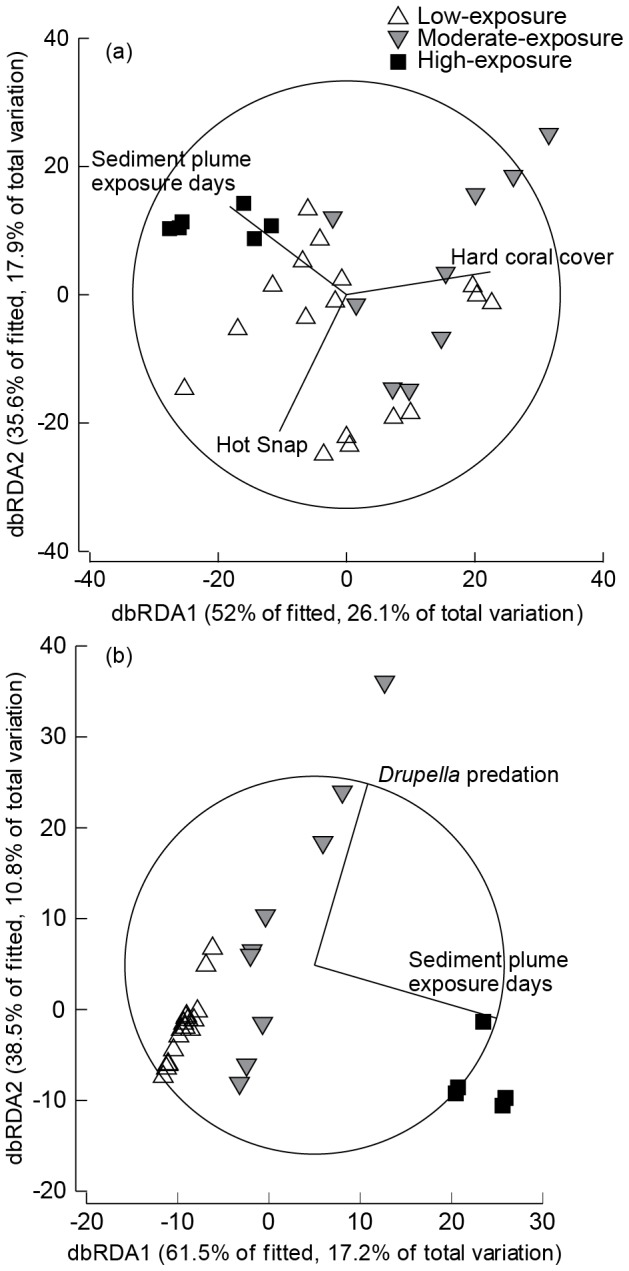
Figure 3. Distance-based redundancy analysis (dbRDA) ordination plots illustrating the relationship between environmental predictors that best explain the variation of (a) coral disease and (b) other compromised coral health indicators among sites.

The dbRDA was constrained by the best-fit explanatory variables from a multivariate multiple regression analysis (DISTLM) and vectors overlays are shown for predictor variables explaining a significant proportion of the variation in the prevalence of (a) coral disease and (b) other compromised coral health indicators.
