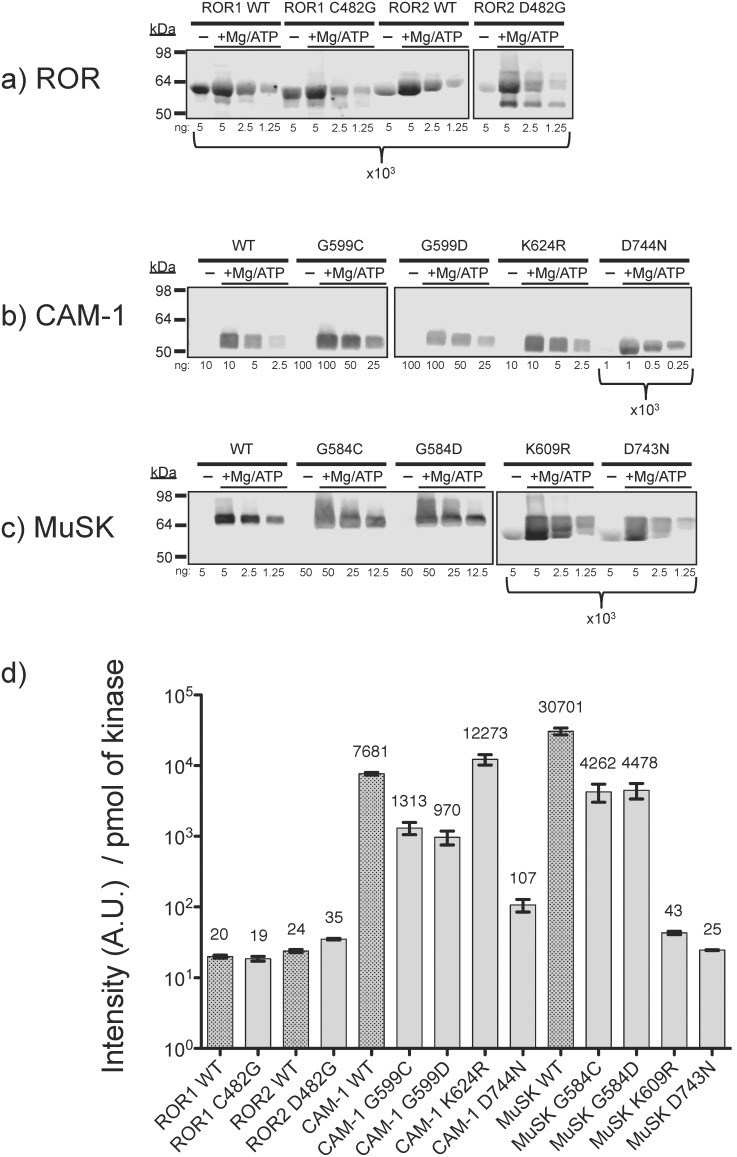
Figure 2. ROR shows limited residual tyrosine autophosphorylation in vitro.
a) ROR, b) CAM-1, c) MuSK and d) Quantitation of signal intensity per pmol of kinase from the above immunoblots. Error bars represent standard error of the mean. ROR proteins were expressed in insect cells and isolated to >95% purity. Phosphotyrosine was detected by anti-phosphotyrosine, after incubation in the presence or absence of magnesium and ATP. The amount of protein loaded is indicated below each lane in nanograms. These data are representative of two or more independent protein expression and isolation experiments. Quantitation data of experimental replicates can be found in Figure S2.

