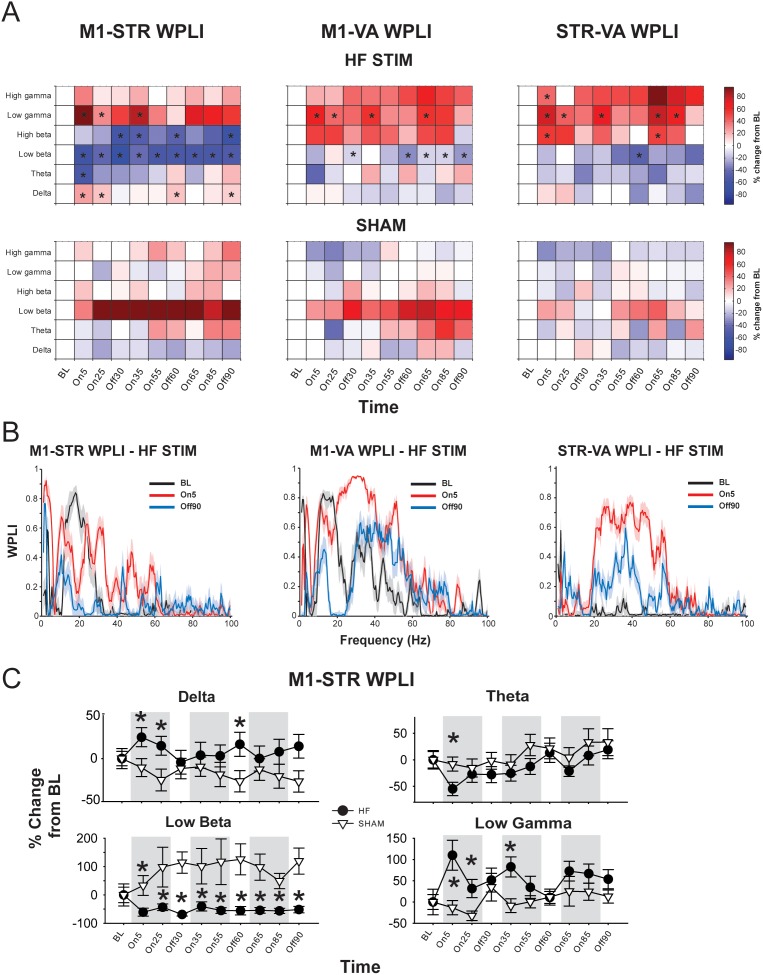
Figure 3. High-frequency (HF) EP DBS produces region- and frequency band-specific effects on functional connectivity.
A. Color plots showing effects of high-frequency (top) or SHAM (bottom) EP DBS on debiased weighted phase lag index (WPLI) between regions according to frequency band and time point. * = significantly different from SHAM (p<0.05). B. Representative WPLI plots from a rat receiving HF stimulation at baseline (BL), in the first five minutes of stimulation (On5), and after 90 minutes of stimulation (Off90). Shaded area represents 95% confidence interval generated using jackknife statistics. C. Effects of HF and SHAM EP DBS on M1-STR WPLI over time. Error bars represent S.E.M. * = significantly different from SHAM (p<0.05).

