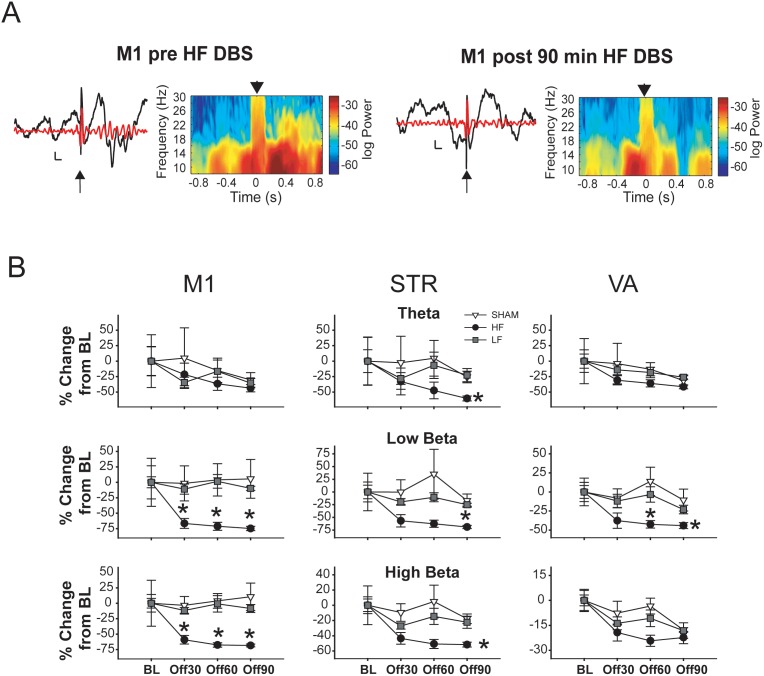
Figure 4. High-frequency (HF) EP DBS suppresses acute EP-induced beta oscillations in all recorded regions.
A. Representative raw (black) and filtered (6–30 Hz; red) voltage traces from M1 (calibration: 200 ms, 0.2 mV) and time-frequency spectrograms showing effects of acute EP stimulation before (left) and after (right) 90 minutes of high-frequency (HF) EP DBS. B. Changes in induced oscillation power according to region and time point. Low-frequency (LF) EP DBS does not suppressed induced oscillations as HF DBS does. Error bars represent S.E.M. * = significantly different from SHAM and LF (p<0.05).

