
Figure 1.

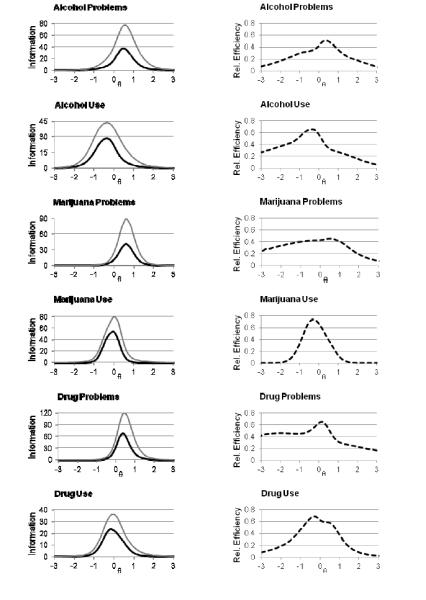

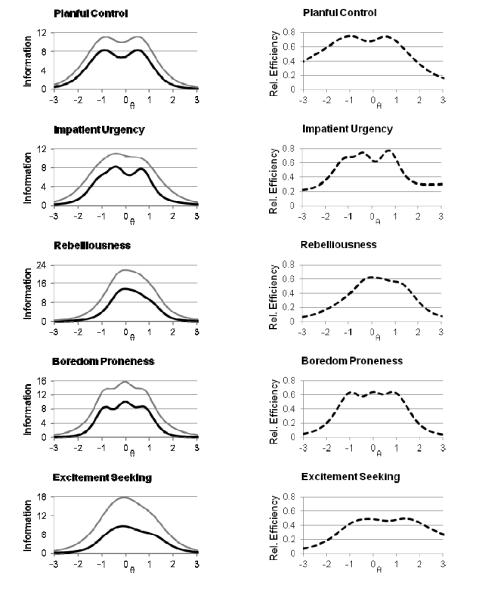
Test information function for full-length and brief facet scales (left side) and relative efficiency for brief and scales (right side), where relative efficiency = proportion of information provided by brief scale relative to its full-length counterpart across trait levels θ.