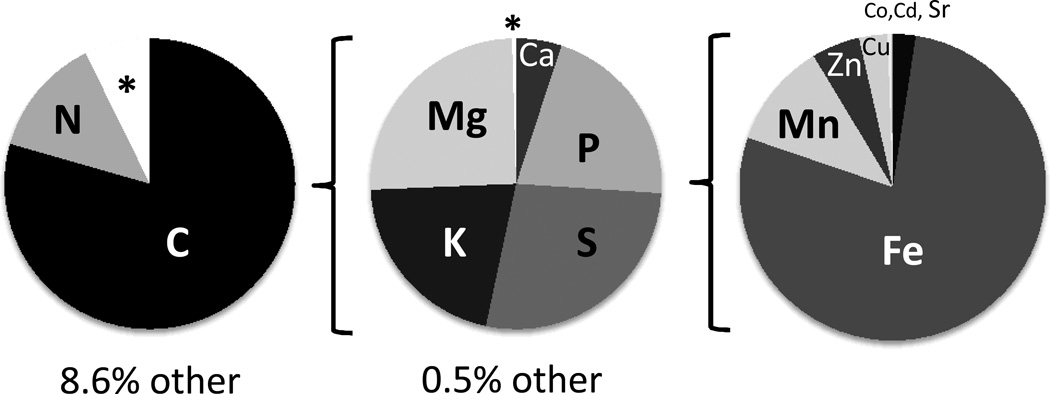
Figure 3.
Atomic composition of Synechococcus sp., a representative of the bacterial phytoplankton. For each pie chart, the portion indicated by the asterisk (other) is expanded in the pie chart to the right. On the far right, Sr is indicated by the black slice and the thin white slice between Cu and Sr includes Co and Cd. Plotted with data from (Quigg et al. 2011).

