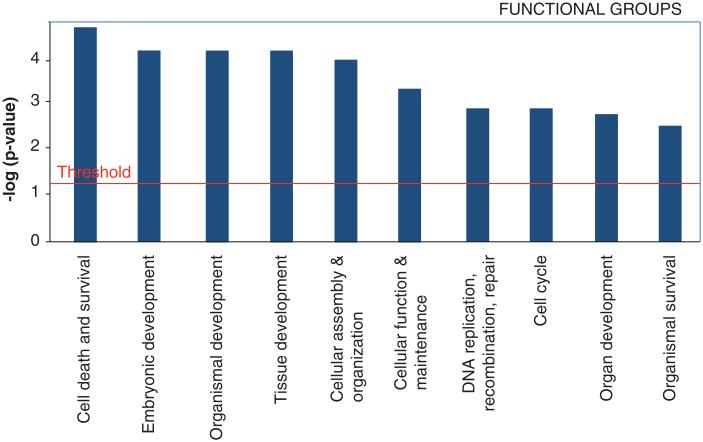
Figure 4. Identification of the top 10 functional groups of all differentially expressed genes (twofold or higher) in Muse cells derived from adipose tissue (Muse-AT) cells versus adipose stem cells (ASCs).
Fischer’s exact test was used to calculate a p-value determining the probability of the association between the genes in the data set with functional groups and canonical pathways. Functional groups are displayed along the x-axis, while the y-axis displays logarithm of p values calculated by Fisher exact between the ratio of the number of genes differentially expressed genes (twofold or higher) in Muse-AT versus ASCs in a given functional group or pathway divided by total number of genes that make up that functional group or pathway with a threshold for statistical significance set at 0.05. The analysis was performed by Ingenuity Pathways analysis software.
Reproduced from [18].

