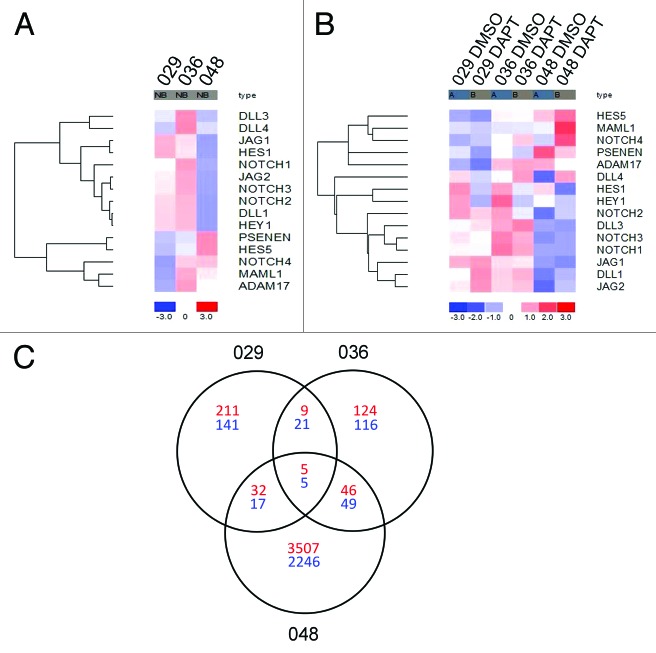
Figure 1. Gene expression analysis revealed different Notch signatures between the GBM neurosphere cultures investigated. (A) Heat map showing the expression of selected Notch pathway components in the 029, 036, and 048 neurosphere cultures. (B) Heat map showing the expression of the same components in the same neurosphere cultures treated with 10 μM DAPT or equal volumes of DMSO for 24 h. In both (A and B) the colors represent the standard deviation in expression level relative to the mean expression of the respective gene across the three or six samples respectively. (C) Venn diagram showing the intersection of the differently expressed genes for each culture with a fold change of minimum ± 1.3. Red numbers refer to upregulated genes in the DAPT treated samples compared with the DMSO control and blue numbers refer to downregulated genes.

An official website of the United States government
Here's how you know
Official websites use .gov
A
.gov website belongs to an official
government organization in the United States.
Secure .gov websites use HTTPS
A lock (
) or https:// means you've safely
connected to the .gov website. Share sensitive
information only on official, secure websites.
