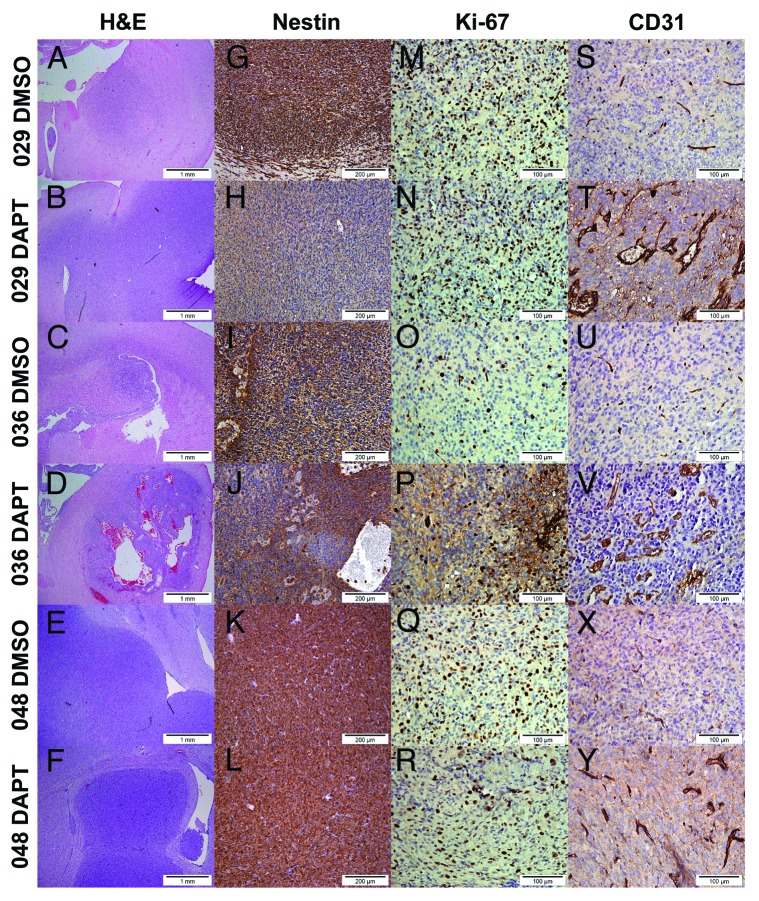
Figure 4. Histology and expression of the stem cell marker Nestin, the proliferative marker Ki-67 and the endothelial cell marker CD31 differed between tumors formed from DMSO and DAPT-treated neurosphere cells. (A–F) H&E of representative tumors from each treatment group of the three tumor-types. Scale bar shows 1 mm. (G–L) Immunodetection of the stem cell marker Nestin. Positive cells stain dark brown in the cytoplasm. Scale bar shows 200 μM. (M–R) Immunodetection of the proliferative marker Ki-67. Positive nuclei are stained dark brown. Scale bar shows 100 μM. (S–Y) Immunodetection of the endothelial marker CD31. Normal vessels are shown as strait brown stripes in the section, while abnormal vessels are detected as disorganized vessels often with multiple endothelial cells constituting the vessel wall. Scale bar shows 100 μM.

An official website of the United States government
Here's how you know
Official websites use .gov
A
.gov website belongs to an official
government organization in the United States.
Secure .gov websites use HTTPS
A lock (
) or https:// means you've safely
connected to the .gov website. Share sensitive
information only on official, secure websites.
