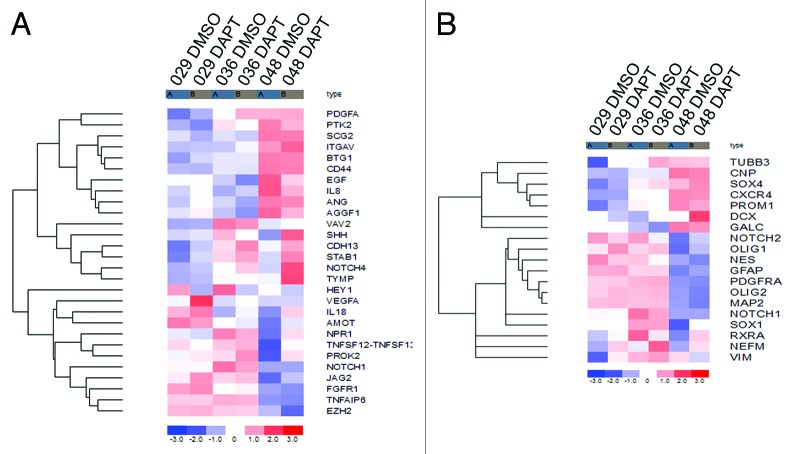
Figure 6. Gene expression of pro-angiogenic, NSC and differentiation markers. (A) Heat map showing the expression of selected pro-angiogenic markers in the 029, 036, and 048 neurosphere cultures treated with 10 μM DAPT or equal volumes of DMSO for 24 h. (B) Heat map showing the expression of selected markers of NSC (PROM1, NES, NOTCH1, NOTCH2, GFAP, CXCR4, SOX1, SOX4, PDGFRA, RXRA, and VIM), the neuronal linage (TUBB3, NEFM, MAP2, and DCX) and the glial lineage (GFAP, GALC, CNP, PDGFRA, VIM, OLIG1, and OLIG2) in the same samples as in (A). The colors represent the standard deviation in expression level relative to the mean expression of the respective gene across the six samples. Notice that some markers represent more than one phenotype, e.g., GFAP is a marker for both NSC and astrocytes.

An official website of the United States government
Here's how you know
Official websites use .gov
A
.gov website belongs to an official
government organization in the United States.
Secure .gov websites use HTTPS
A lock (
) or https:// means you've safely
connected to the .gov website. Share sensitive
information only on official, secure websites.
