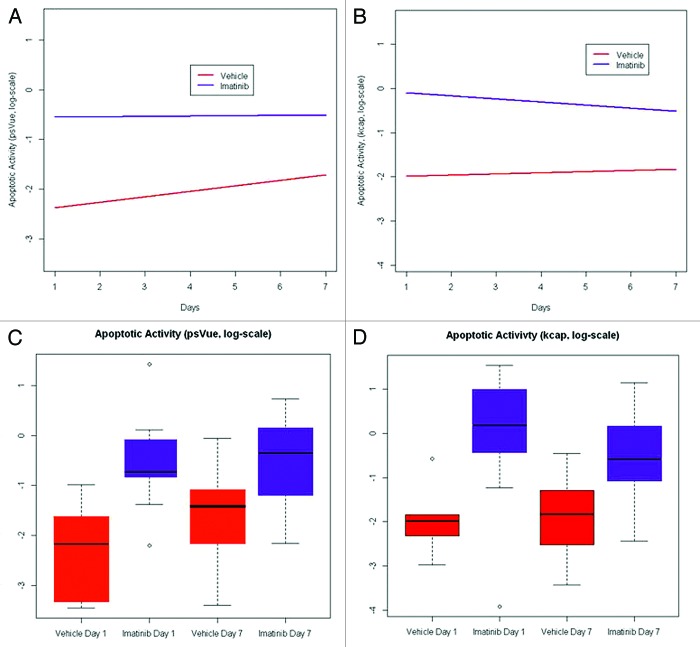
Figure 2. Quantification of IM-related apoptosis using NIR probes with FMT imaging. Change in apoptotic activity measured by the PSVueTM794 (A) and KcapQ647 (B) probes between day 1 and day 7 of treatment with IM or vehicle control. Each measurement on apoptotic activity was normalized to its corresponding tumor volume measurement obtained using MRI and expressed as a ratio (on the log-scale). A longitudinal model based on the generalized estimating equations approach was used to model the effect of treatment and time on apoptotic activity, adjusted for potential batch effects in the experiment. Statistically significant increases in the rate of apoptotic activity due to IM treatment (compared with control) was observed (P value = 1.41e−04 and 0.002, respectively) using data from the PSVueTM794 and KcapQ647 probes. Box-and-whisker plots of the apoptotic activity measured by the PSVueTM794 (C) and KcapQ647 (D) probes on the logarithmic scale for various treatment-time combinations. In each plot, box height represents the inter-quartile range (IQR) where the upper and lower ends indicate the third and first quartiles, respectively. The solid black horizontal line inside the box represents the median value while the whiskers (the two solid horizontal lines at either end, connected by dotted lines) extend to the most extreme data points which are no more than 1.5 times the IQR from the box in each direction. Using this criterion, points that lie beyond these whiskers are considered to be outliers (open circles).

An official website of the United States government
Here's how you know
Official websites use .gov
A
.gov website belongs to an official
government organization in the United States.
Secure .gov websites use HTTPS
A lock (
) or https:// means you've safely
connected to the .gov website. Share sensitive
information only on official, secure websites.
