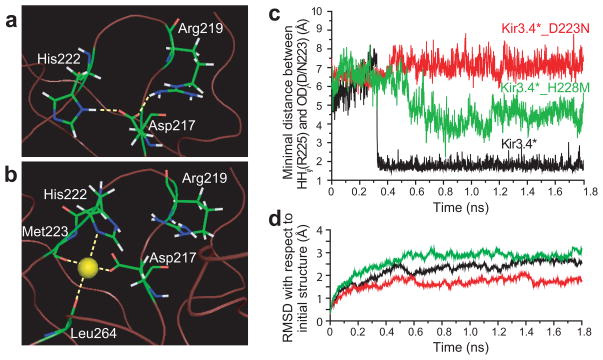
Figure 2.
H-bonding pattern between position 217 and residues in its vicinity in (a) Kir3.1_N217D after minimization. The model was based on the crystallographic structure of Kir3.1 (PDB accession number 1N9P19). (b) H-bonding pattern between the Na+ ion and the residues that surround it in its coordination site in Kir3.1_N217D. (c) Minimal distance between positions 223 and 225 as obtained from MD simulations of Kir3.4, Kir3.4_D223N, and Kir3.4_H228M. (d) RMSD of the backbone residues of the cytosolic domain relative to the starting minimized structure that corresponds to the MD simulations of Kir3.4, Kir3.4_D223N, and Kir3.4_H228M. The calculations were performed using Simulaid: http://atlas.physbio.mssm.edu/~mezei/simulaid/simulaid.html). Figures a, and b were drawn using PyMol48.

