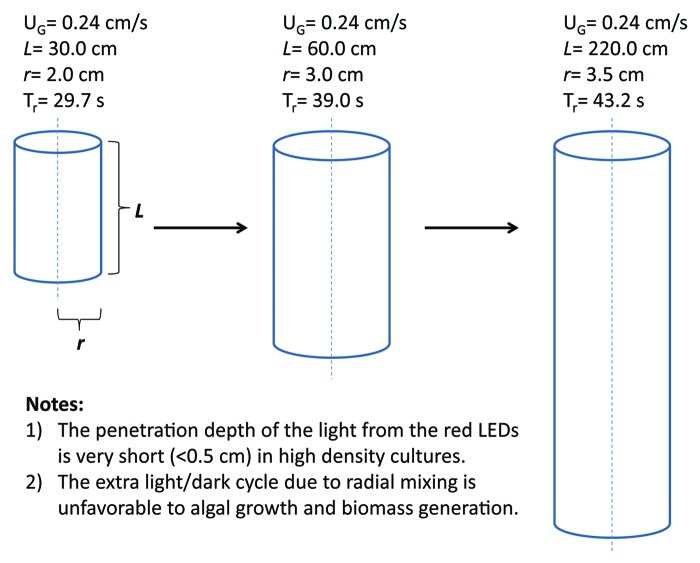
Figure 2. Illustration of the effect of bubble column PBR size on radial mixing times. Tr represents radial mixing time, calculated according to Rubio et al.26 UG refers to the superficial velocity of input gases. L and r are the length and the radius of the PBR, respectively.

An official website of the United States government
Here's how you know
Official websites use .gov
A
.gov website belongs to an official
government organization in the United States.
Secure .gov websites use HTTPS
A lock (
) or https:// means you've safely
connected to the .gov website. Share sensitive
information only on official, secure websites.
