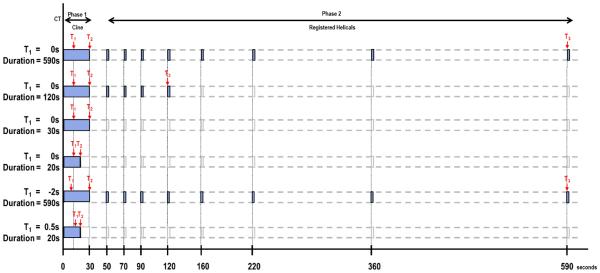
FIGURE 1. Schematic of overall study evaluating effects of acquisition duration and pre-enhancement setpoints.
First row: Reference dataset: Phase 1, combined with 8 anatomically registered Phase 2 images. T1, pre-enhancement setpoint; T2, last first phase setpoint; T3, last second phase (“post-enhancement”) setpoint.
Second row: Reduction in acquisition duration affecting Phase 2 (T3).
Third row: Reduction in acquisition duration, T2=30s.
Fourth row: Reduction in acquisition duration affecting Phase 1 (T2).
Fifth row: Displacement of pre-enhancement setpoint: T1 displacement backwards in increments (−0.5s, −1.0s, −2.0s). Analyses of 2nd, 3rd and 4th rows were repeated.
Sixth row: Displacement of pre-enhancement setpoint: T1 displacement forwards in increments (+0.5s, +1.0s, +2.0s). Analyses of 2nd, 3rd and 4th rows were repeated.

