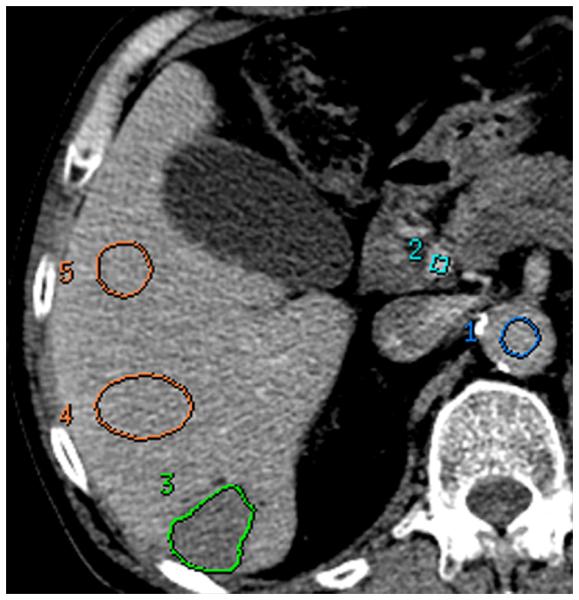
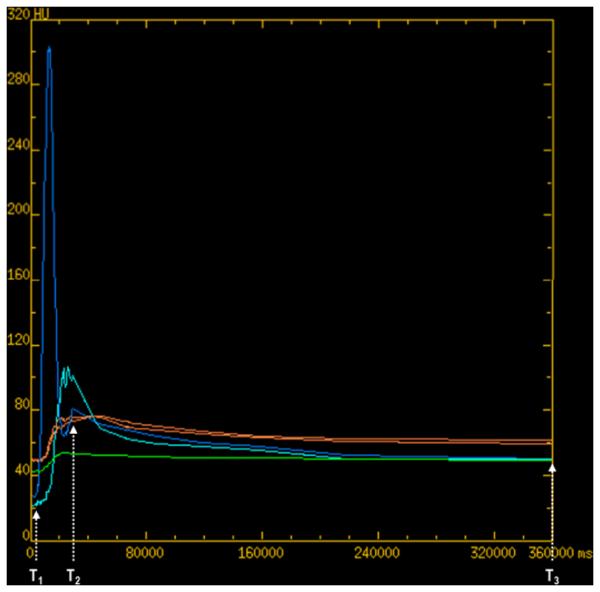
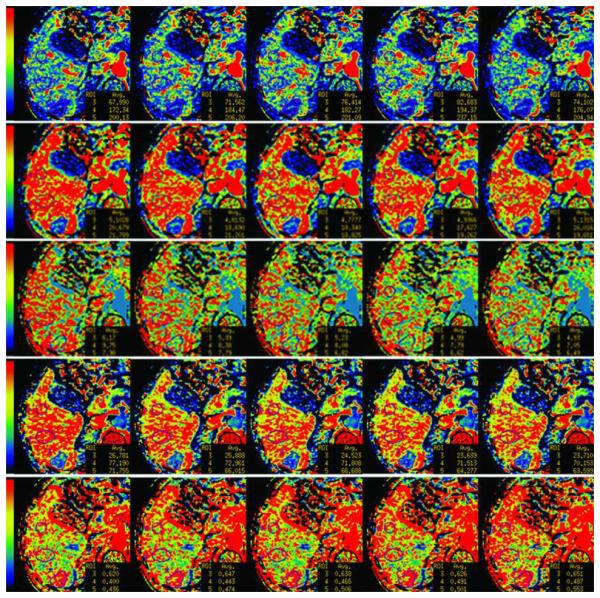
FIGURE 2. 70 year old male with metastatic carcinoid to the liver.


(a): reference CTp image with tissue ROIs, (b) corresponding time-attenuation curves. Aortic and portal vein (dark blue and light blue respectively), tumor (green), and normal liver (orange). X-axis in milliseconds.
(c) Parametric maps for BF, BV, MTT, PS and HAF (first to fifth rows, respectively) with illustrative examples of pre-enhancement setpoints at −2.0s, −0.5s, 0s (reference), +0.5s, +2.0s (left to right columns, respectively). BF, in mL/min/100g; BV, in mL/100g; MTT, in seconds; PS, in mL/min/100g; HAF, unitless. The color scales are identical for individual rows of parametric maps. Differences in maps can be seen when comparing left-hand columns and right-hand columns.
