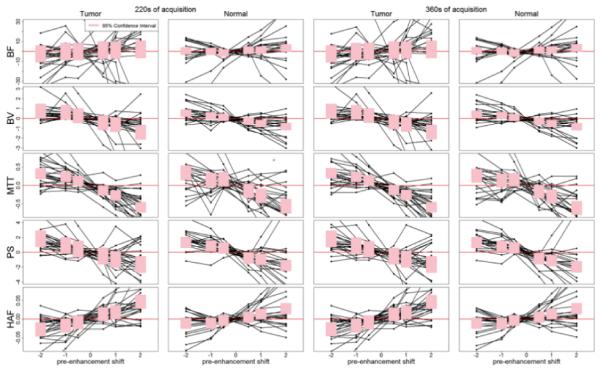
FIGURE 4.

Deviation of CTp parameter values from reference at T1 = 0s as a function of displacement in pre-enhancement setpoints. Solid lines connect deviations observed within the same ROI. Shaded pink regions correspond to 95% confidence intervals for the displacement effects; over-lapping of the shaded regions with the horizontal red line indicates non-significant deviation from the reference pre-enhancement setpoint of T1=0s. Plots presented for 220s (two left-hand columns) and 360s (two right-hand columns). y-axes: BF, in mL/min/100g; BV, in mL/100g; MTT, in seconds; PS, in mL/min/100g; HAF, unitless.
