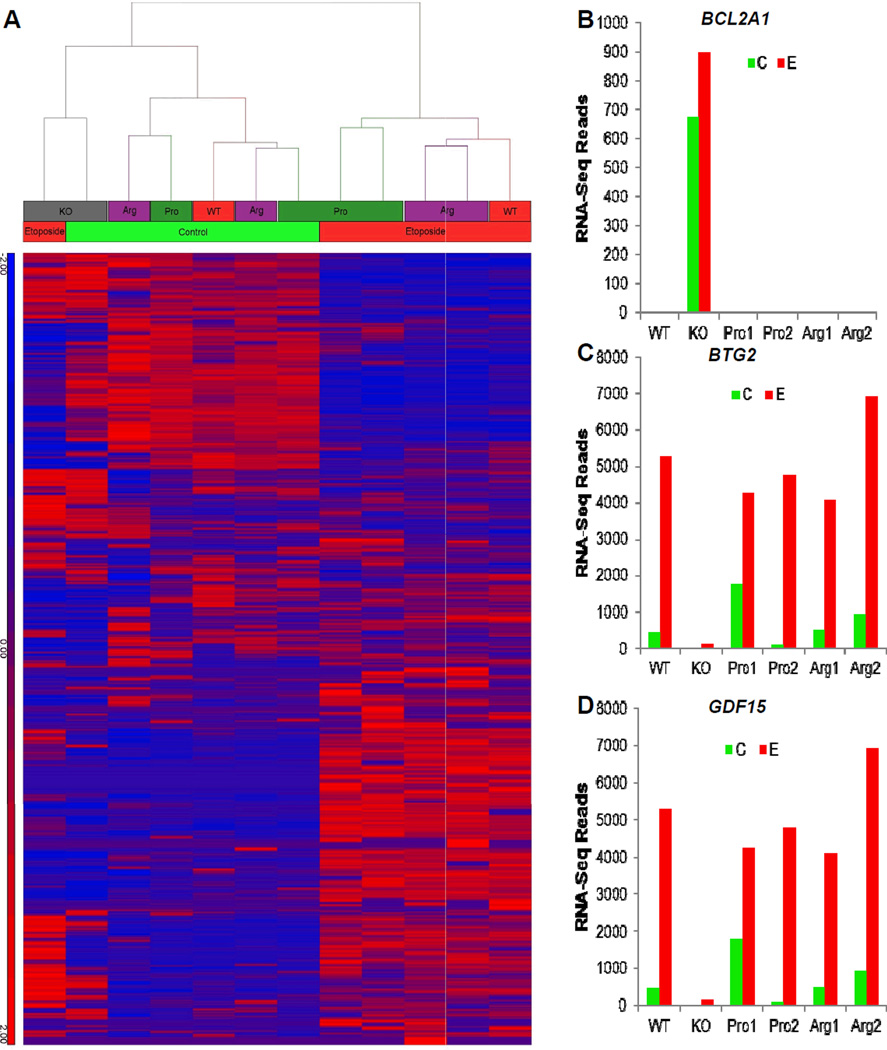
Figure 3. Overview of the RNAseq Data.
(A) After alignment using the CLC Genomics Workbench, the number of reads per exon for each gene used as an input for hierarchical clustering analysis. Blue denotes low counts, whereas red denotes high counts. (B–D) RNA-Seq transcript expression profile for TP53 effectors bcl2a1 (B), btg2 (C), and gdf15 (D).The x-axis indicates cell line, and the y-axis denotes the transcript expression levels.

