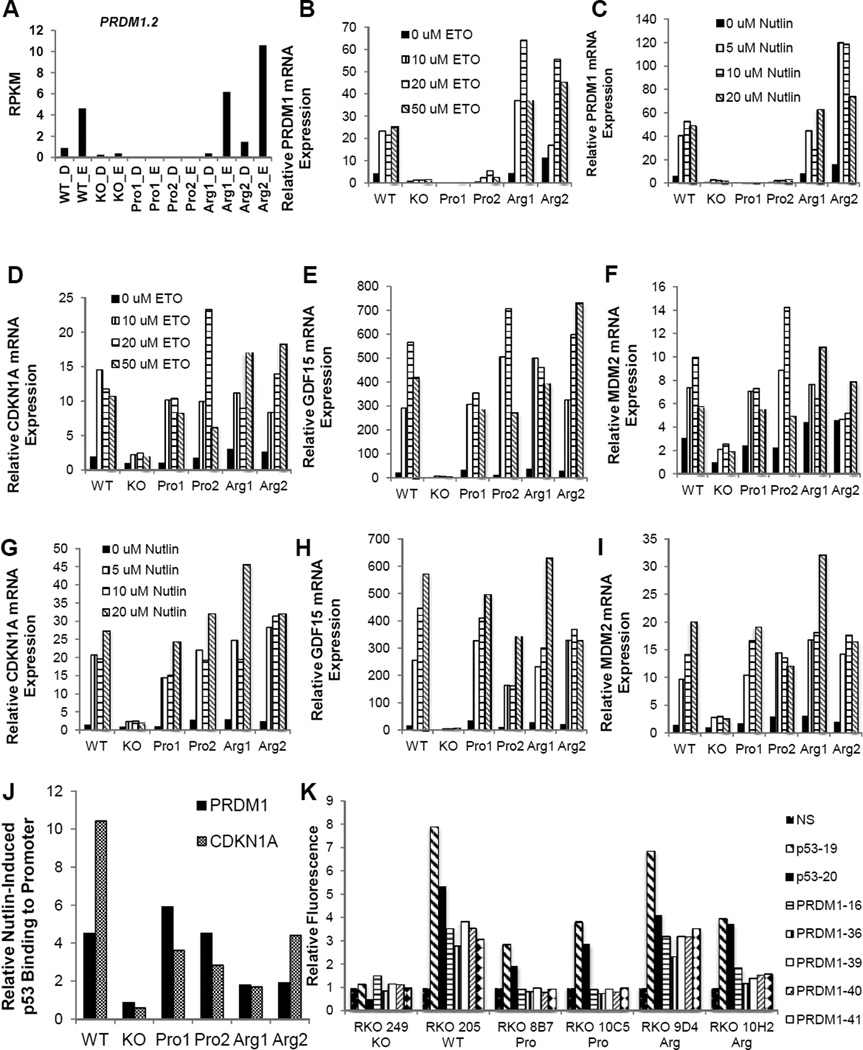
Figure 6. Validation of the Arg-Specific Transcript PRDM1β.
(A) RNAseq transcript expression profile for PRDM1β. (B–C) PRDM1β expression induced by various doses of etoposide (B) or Nutlin-3a (C) in different cell lines as measured by qPCR. (D–I) Expression of TP53 positive controls (CDKN1A, GDF15, MDM2) induced by various doses of etoposide (D–F) or Nutlin-3a (G–I) in different cell lines, as measured by qPCR. (J) Amount of PRDM1 or CDKN1A DNA pulled down by p53-ChIP as measured by qPCR. Cells were treated with Nutlin-3a or control, and the ratio of measurements obtained for these two treatment conditions is plotted for each gene and cell line. A value of 1 indicates that Nutlin-3a did not induce any additional p53 binding to the gene of interest. (K) Cells containing shRNA after 1 week treatment with Nutlin-3a, measured by FACS analysis selecting for GFP expression. Data shown as fold change compared to NS shRNA.

