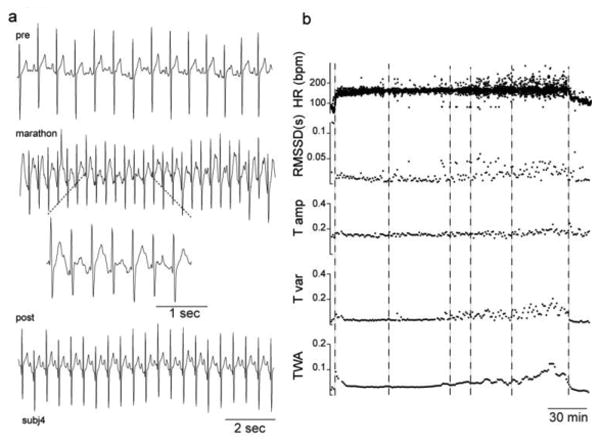
Fig. 1.

Sample data from one subject. a) Detrended ECG data recorded from the Holter before (pre), during (marathon), and after the marathon (post.) The dotted lines denote an expanded view of the ECG data. b) Heart rate (HR) in beats per minute (bpm), HRV (RMSSD) in seconds (s), and T-wave amplitude (T amp), T-wave variability (T var), and T-wave alternans (TWA) in arbitrary units from the same subject as Figure a are plotted as a function of time instantaneously (HR) or in 1-minute intervals (all others). Box and whisker plots represent range, median, and interquartiles. Vertical dashed lines indicate the start, the 10-kilometer marker, the half-marathon marker, the 15-mile marker, the 20-mile marker, and the finish line.
