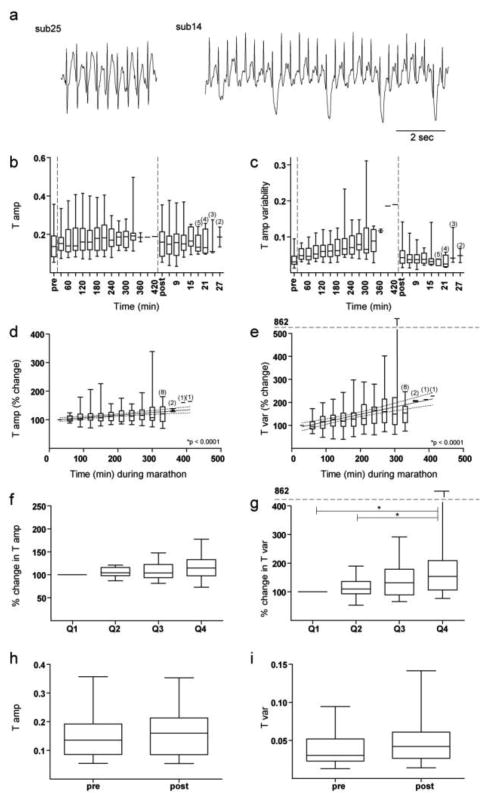
Fig. 4.

Changes in T-waves before, during, and after the marathon. a) Examples of ECG tracings from 2 subjects showing variability in T-waves during the marathon. b) T-wave amplitude before, during, and after the marathon are plotted continuously in arbitrary units. c) T-wave amplitude variability before, during, and after the marathon are plotted continuously in arbitrary units. d) The change in T-wave amplitude over time during the marathon in 30-minute non-overlapping intervals. e) The change in T-wave amplitude variability over time during the marathon in 30-minute non-overlapping intervals. f) The change in T-wave amplitude during each proportion of the marathon. g) The change in T-wave amplitude variability during each proportion of the marathon. h) T-wave amplitude pre- versus post-marathon in arbitrary units. i) T-wave amplitude variability pre- versus post-marathon in arbitrary units. Unless otherwise stated, all conformities of Figure 4 are identical to that of Figure 2.
