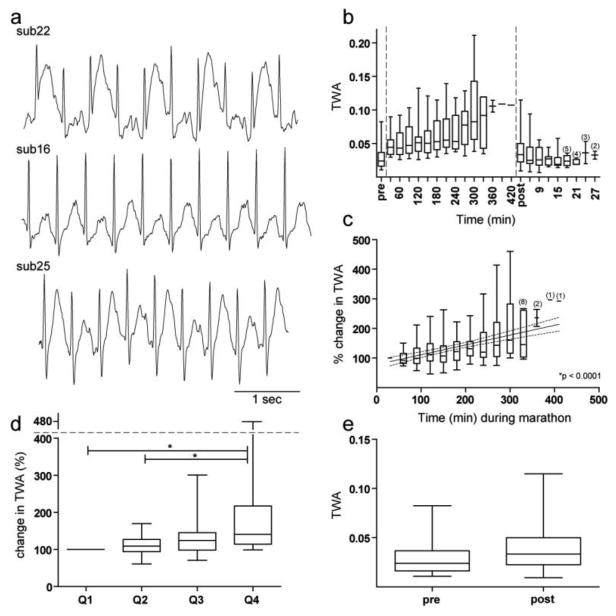
Fig. 5.

Changes in TWA before, during, and after the marathon. a) Examples of ECG tracings from 3 separate subjects showing evidence of TWA during the marathon. b) TWA before, during, and after the marathon are plotted continuously in arbitrary units. c) The change in TWA over time during the marathon in 30-minute non-overlapping intervals. d) The change in TWA during each proportion of the marathon. e) TWA pre- versus post-marathon in arbitrary units. Unless otherwise stated, all conformities of Figure 5 are identical to that of Figure 2.
