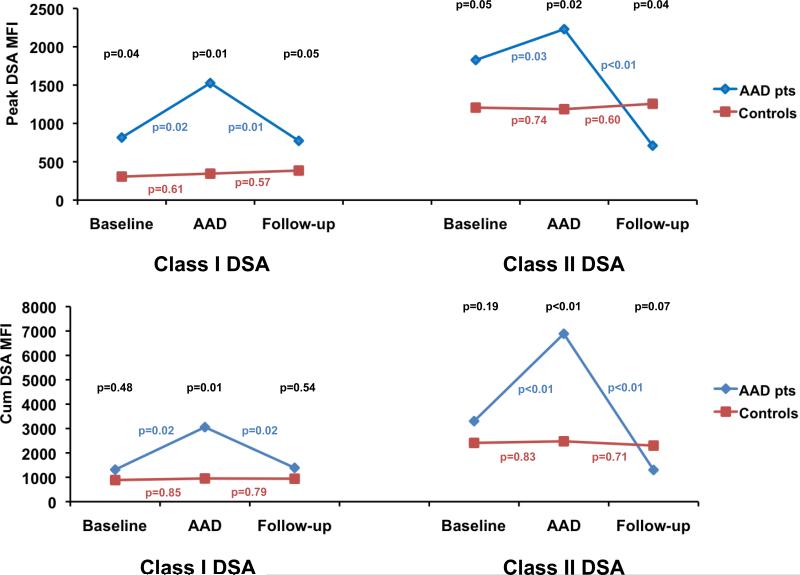
Figure 1. Serial donor specific antibody levels in acute allograft dysfunction patients and controls.
Mean peak (top) and cumulative (bottom) anti-HLA class I (left) and class II (right) donor specific antibody (DSA) MFI levels of acute allograft dysfunction (AAD) patients (blue) and control heart transplant recipients (red) at baseline, AAD diagnosis (or time of matching for controls) and follow-up. P-values above the curves (in black) compare DSA levels between AAD patients and controls at each matched time point. P-values adjacent to the curves compare serial DSA levels between time points for AAD patients and controls, respectively. HLA-human leukocyte antigen, MFI-mean fluorescence intensity level.

