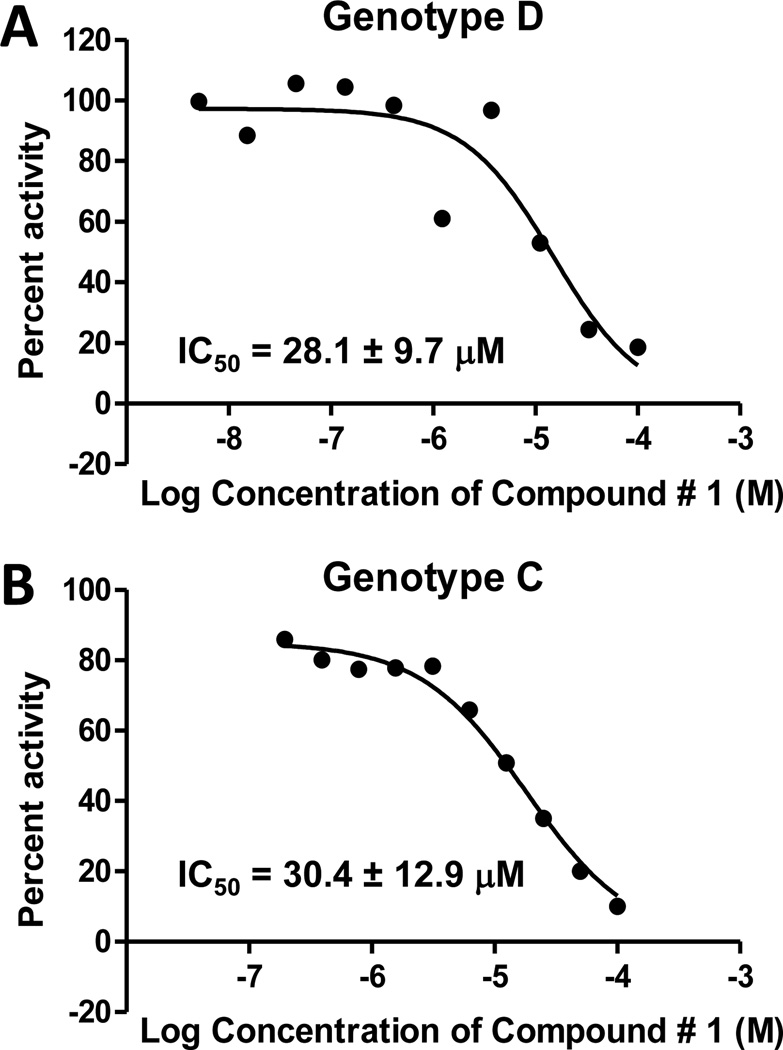
Fig. 3. Dose-response curves with compound #1 in the oligonucleotide-directed RNA cleavage assay against the HBV RNaseH.
A. Genotype D RNaseH. B. Genotype C RNaseH. The curves are from representative assays. The numerical values are the average ± one standard deviation from three or four independent assays.

