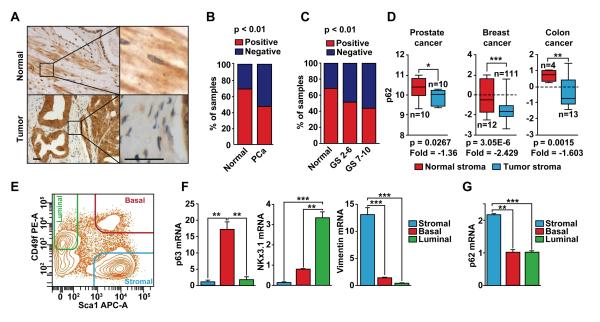
Figure 1. p62 levels are reduced in the stroma of human prostate tumors.
(A) Representative examples of p62 staining of normal and primary prostate cancer (tumor) samples. Scale bars, 25 μm (B) Quantification of p62 staining in the stroma of primary PCa tumors as compared to normal; n = 22 (normal); n = 202 (PCa). Fisher test, p < 0.01. (C) p62 levels are reduced upon PCa progression; n = 22 (normal); n = 70 (GS 2-6); n = 132 (GS 7-10). Chi-square, p < 0.01. (D) p62 mRNA levels in stroma of human cancer samples. Data was collected from public datasets of gene expression in the tumor stroma of several human cancers. GSE34312 (prostate cancer), GSE9014 (breast cancer), and GSE35602 (colon cancer). (E) FACS-sorted adult murine prostate cell linages. Prostate basal, luminal, and stromal cells are Lin−Sca-1+CD49fHi, Lin−Sca-1−CD49fLow, and Lin−Sca-1+CD49f−, respectively. (F) RT-PCR of specific markers for each prostate cell population (n = 3): p63 (basal), Nkx3.1 (luminal), and vimentin (stromal). (G) RT-PCR for p62 in prostate cell populations (n = 3). *p < 0.05, **p < 0.01. ***p < 0.001. Results are presented as mean ± SEM. See also Figure S1.

