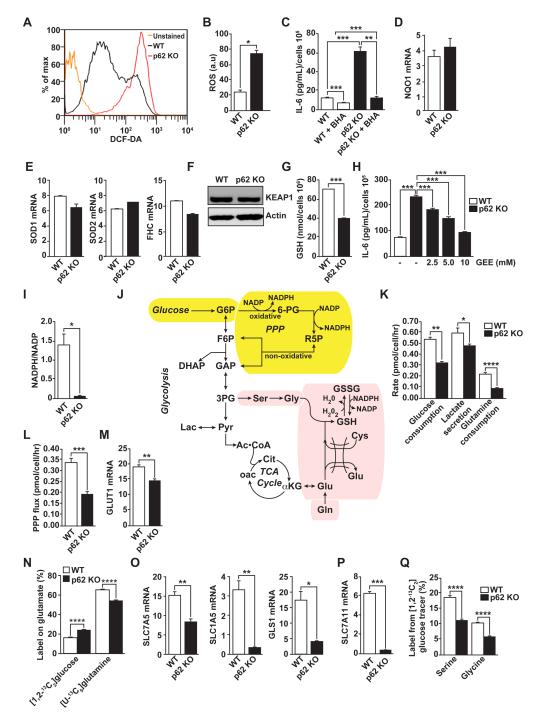
Figure 4. Metabolic reprogramming in p62-deficient stroma.
(A and B) Total intracellular levels of ROS in WT and p62 KO fibroblasts (A) and quantification (B); n = 4. (C) IL-6 ELISA of WT and p62 KO fibroblasts treated with vehicle or ROS scavenger BHA (100 μM) for 12 hr (n = 4). (D and E) RT-PCR of NQO1 (D) and SOD1, SOD2 and FHC (E) mRNA levels in fibroblasts (n = 4). (F) Immunoblot analysis of KEAP1 in cell lysates from WT and p62 KO fibroblasts. Results are representative of three experiments. (G) Cellular GSH levels in WT and p62 KO fibroblasts (n = 4). (H) IL-6 ELISA of fibroblasts treated with increasing concentrations of glutathione analog GEE (n = 4). (I) Cellular NADPH/NADP levels in WT and p62 KO fibroblasts (n = 4). (J) Metabolic scheme depicting biosynthetic routes to NAPDH (yellow shading) and GSH (pink shading) from glucose and glutamine. (K) Glucose consumption, lactate secretion, and glutamine consumption rates determined by spent medium analysis from WT and p62 KO fibroblasts (n = 3). (L) PPP flux estimates from metabolic flux analysis in WT and p62 KO fibroblast cultures labeled with [1,2-13C2]glucose (n = 3). (M) RT-PCR of GLUT1 mRNA (n = 4). (N) Glutamate labeling in WT and p62 KO fibroblasts grown in either [1,2-13C2]glucose and unlabeled glutamine or [U-13C5]glutamine and unlabeled glucose (n = 3). (O and P) RT-PCR of SLC7A5, SLC1A5 and GLS1 (O) and SLC7A11 (P) mRNA levels in WT and p62 KO fibroblasts (n = 3). (Q) Labeling of serine and glycine from [1,213C2]glucose (n=3). *p < 0.05, **p < 0.01, ***p < 0.001, ****p < 0.0001. Results are presented as mean ± SEM.

