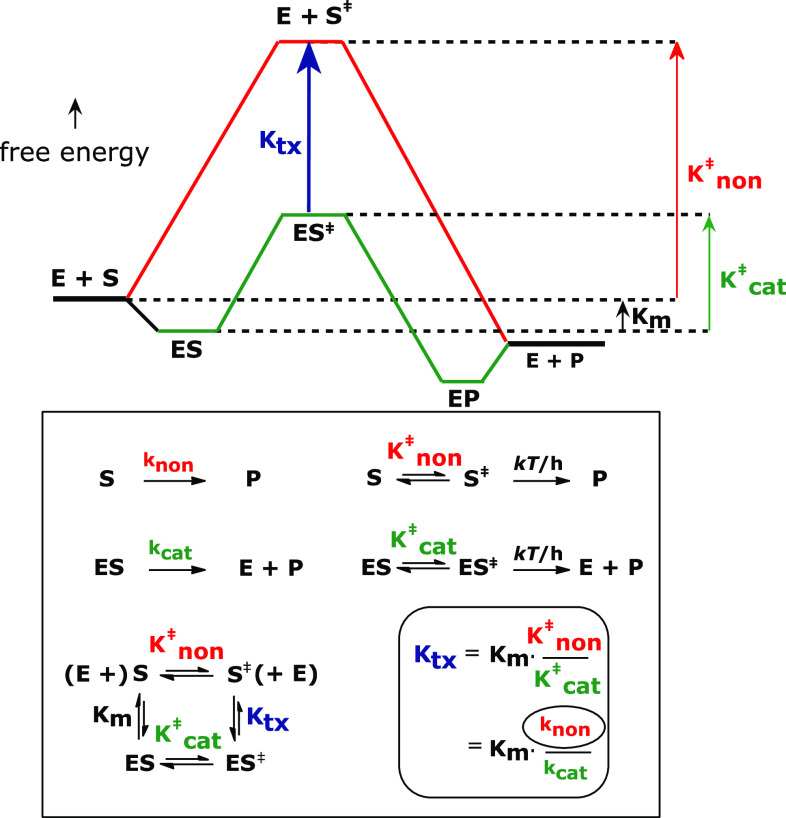
Fig. 1.
Free energy diagram for enzyme catalysis, showing the path of the nonenzymatic reaction (red) and the enzyme reaction (green). Estimation of the dissociation constant of the enzyme from the altered substrate in the transition state requires knowledge of the rate constant of the uncatalyzed reaction

