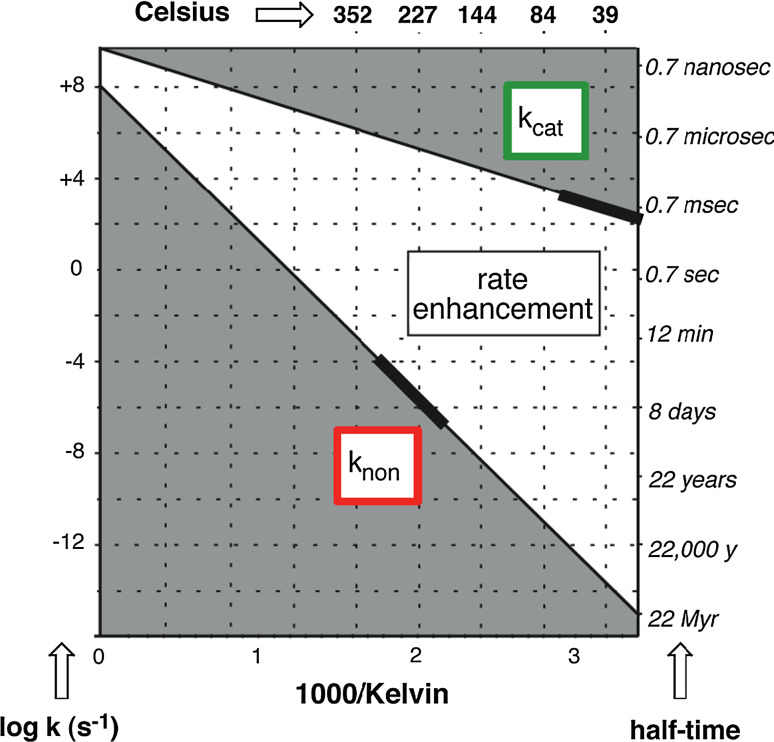
Fig. 6.
Arrhenius plots for the enzymatic and nonenzymatic reactions catalyzed by a α-glucosidase. The bold segments of the lines show the range of temperatures over which rate measurements were conducted. Reprinted with permission from Wolfenden et al. (1999) J. Amer. Chem. Soc. 121, 7419–7420. Copyright 1999 American Chemical Society

