
Figure 9.
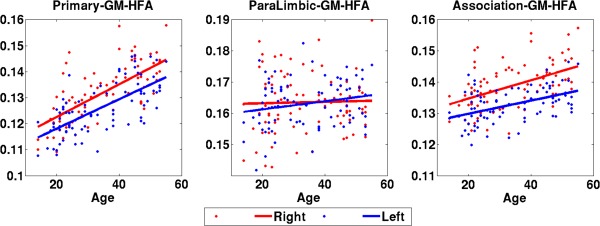
Cortical gray matter heterogeneity (HFAt) in the three functional zones (primary, paralimbic, and association—left to right) for both the hemispheres. Statistically significant increase can be seen in the primary and the association zones, but not in the paralimbic areas. [Color figure can be viewed in the online issue, which is available at http://wileyonlinelibrary.com.]