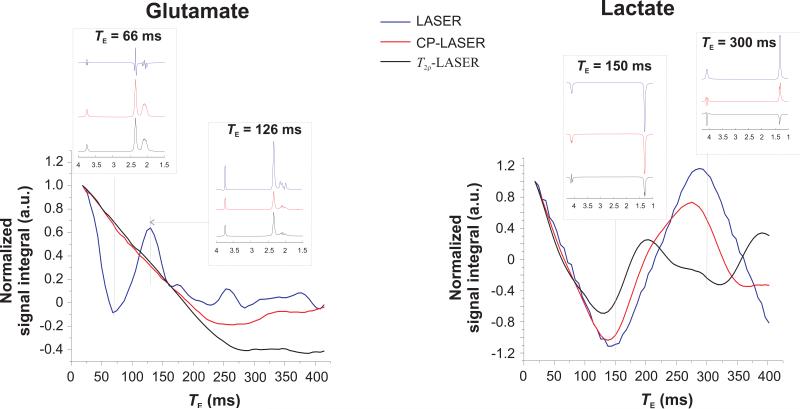
Figure 4.
Effect of CP pulse trains on the J-evolution of glutamate (strongly coupled system) and lactate (weakly coupled system). Signal integral (without taking into account T2 relaxation) which corresponds to the amplitude of the first point of the simulated FID normalized to 1 at TE of 18 ms is shown as a function of TE for LASER (blue line), CP-LASER (black line) and T2ρ-LASER (red line) sequences at 9.4 T. Inserts show the spectral pattern of glutamate at TE = 66 and 126 ms, and lactate at TE = 150 and 300 ms for the three sequences. Although the signal integral of glutamate with LASER is almost zero at TE = 66 ms, there is sufficient signal intensity for precise LCModel fitting. At TE = 126 ms, the signal intensity (without T2 relaxation) of glutamate with LASER is 2.5 times higher than that with T2ρ-LASER. It is possible that for certain TEs and certain metabolites, LASER sequence might have more signal than CP-LASER or T2ρ-LASER.
The simulated spectra are shown line-broadened (10 Hz exponential line-broadening).

