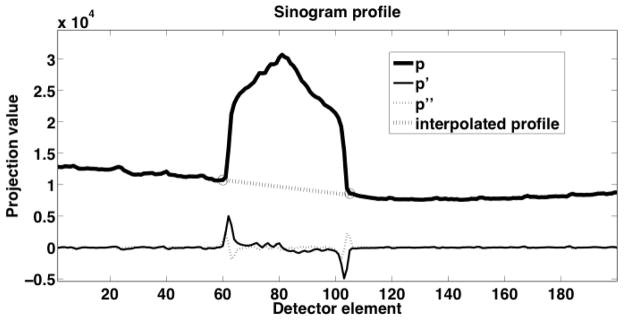
Figure 4.

Profile (p) of attenuation within the search region on one detector row. The first two derivatives (p′ and p″) of the profile were used to determine the edges (marked with circles) of the metal trace in the sinogram. The dashed line indicates the linearly interpolated values that replace metal affected detector elements.
