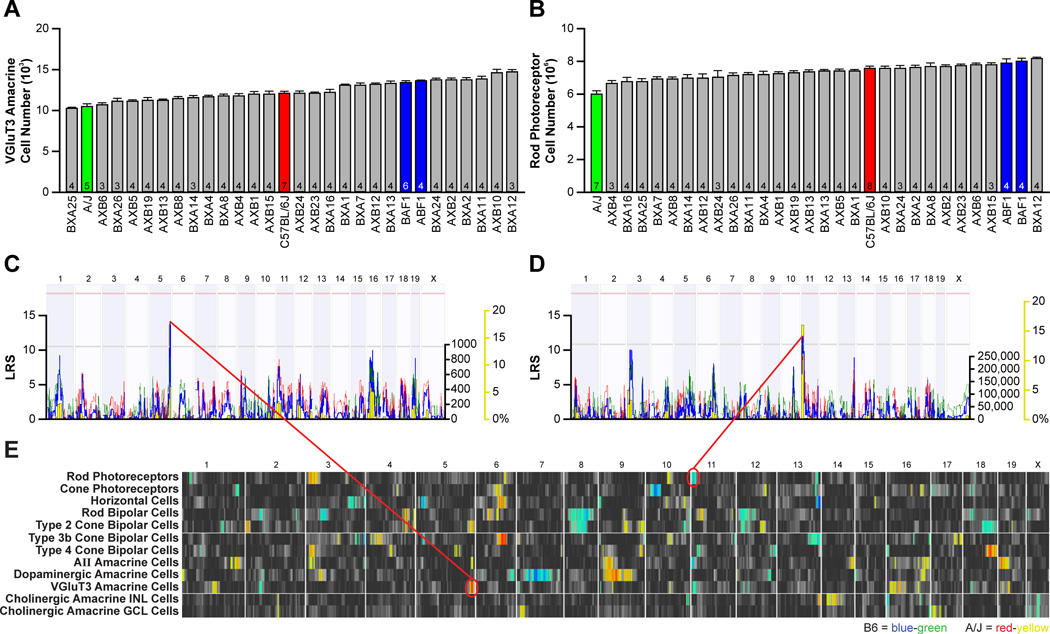
Figure 3. Strain variation for each cell type maps largely to independent genomic loci.
A, B: Variation in VGluT3 amacrine cell number (A) and rod photoreceptor number (B) across the 30 strains. Data represented as mean ± s.e.m. and n = number of retinas analyzed. C, D: The variation in VGluT3 amacrine cell number mapped to a locus on Chr 5 (C), where A alleles correlated with an increase in cell number. Variation in rod photoreceptor number mapped to a locus on Chr 11 (D), where B alleles correlated with an increase in rod number. E: QTL heat-maps derived from LRS scores using marker regression showed multiple QTL for many of the cell types. Blue-green regions indicate loci where the presence of B alleles correlate with an increase in trait values, while red-yellow regions indicate loci where A alleles correlate with an increase in trait values. Large-effect QTL (summarized in Figure 1C) are mapped for all but one cell type, and multiple QTL are often mapped for some cell types, but variation between cell types rarely maps to the same genomic locus.

