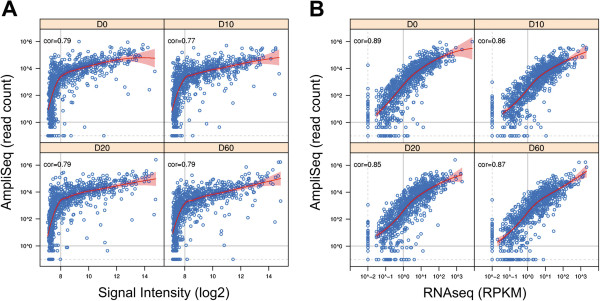
Figure 2.

Comparison of RNA- profiling to microarrays and quantitative RNA sequencing. (A) Correlation of gene expression profiles generated by AmpliSeq-RNA (y-axis) and DNA microarrays (x-axis) using identical RNA samples. Each circle corresponds to one gene of our custom gene panel measured on both platforms. Curves in red indicate the local regression (LOESS) fit between the two profiles, and shades in red give 95% confidence interval of the fitting. The grey vertical line indicates the detection limit of microarrays and horizontal line the arbitrary detection limit of less than one read per sample. (B) Gene expression profiles of the same samples probed by AmpliSeq-RNA (y-axis) and by conventional quantitative RNA sequencing (x-axis). Curves and shades in red, like in (A), give the LOESS fit and 95% confidence interval of the fitting. Horizontal and vertical dash lines indicate the detection limit and transcripts below one count per gene are considered as being absent. Time points of each panel are indicated in the top bar and the correlation coefficient is displayed in the top left corner of each diagram.
