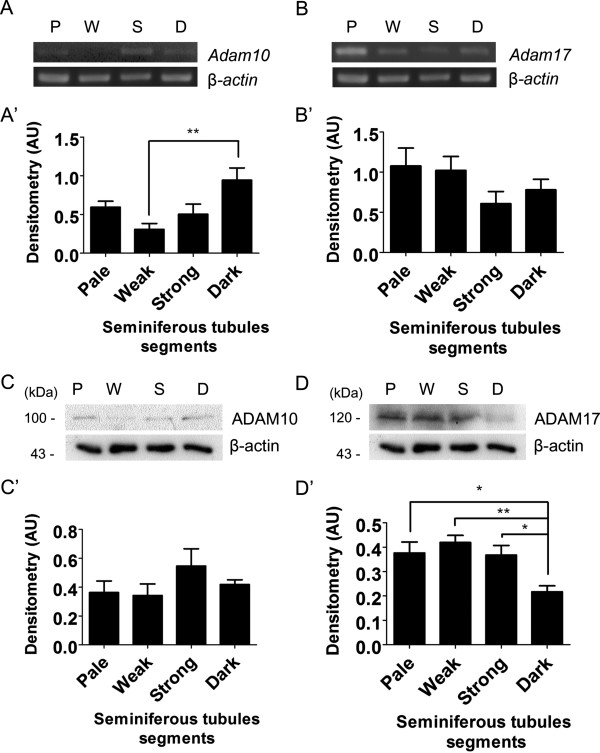
Figure 1.

mRNA and protein levels of ADAM10 and ADAM17 in different segments of rat seminiferous tubules. Adam10 (A, A’) and Adam17 (B, B’) mRNA determined by semi-quantitative RT-PCR in Pale (P, stage IX-XII), Weak (W, stage XIII-I), Strong (S, stage II-V) and Dark (D, VI-VIII) segments using B-actin as a loading control. mRNA levels of Adam10 were significantly higher in Dark than Weak segments, while Adam17 levels did not change. ADAM10 (C, C’) and ADAM17 (D, D’) protein levels were determined by Western blotting (C, D) and then by densitometry using β-actin as a loading control. Protein levels of ADAM10 were similar in Pale (P, stage IX-XII), Weak (W, stage XIII-I), Strong (S, stage II-V) and Dark (D, VI-VIII) segments. On the other hand, ADAM17 protein levels significantly decreased in Dark as compared with the other segments. Bars represent the mean ± S.E.M. of three different experiments (*p < 0.001, **p < 0.01).
