Figure 2.

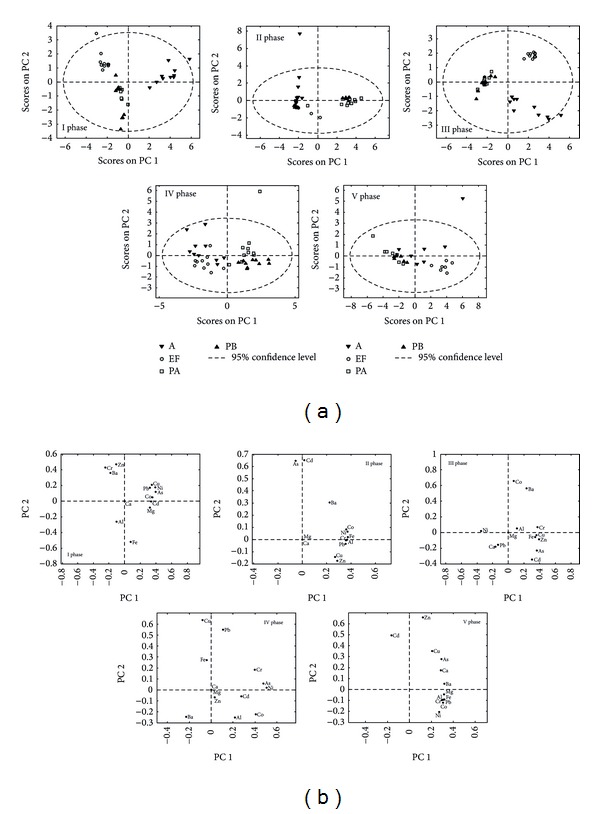
PCA, (a) score plots for each phase of extraction, respectively; (b) loading plots for each phase of extraction, respectively.

PCA, (a) score plots for each phase of extraction, respectively; (b) loading plots for each phase of extraction, respectively.