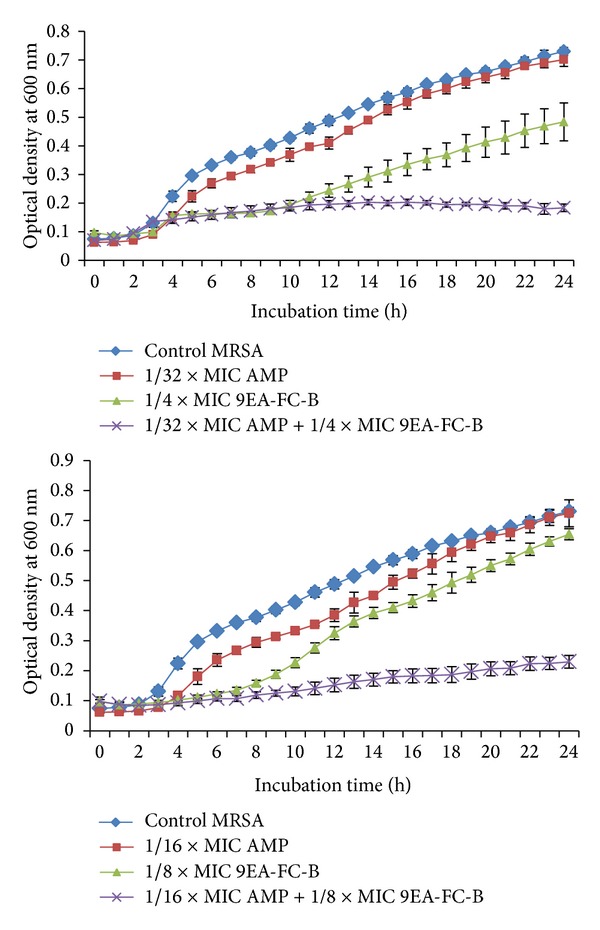
Figure 1.

Effects of subinhibitory concentration of ampicillin alone, 9EA-FC-B alone and combination treatment on the growth of MRSA. Cell growth was measured by using OD at 600 nm at indicated time points. The curves represent triplicates of three independent experiments. Error bars show the standard deviation (AMP = ampicillin, MIC = minimum inhibitory concentrations).
