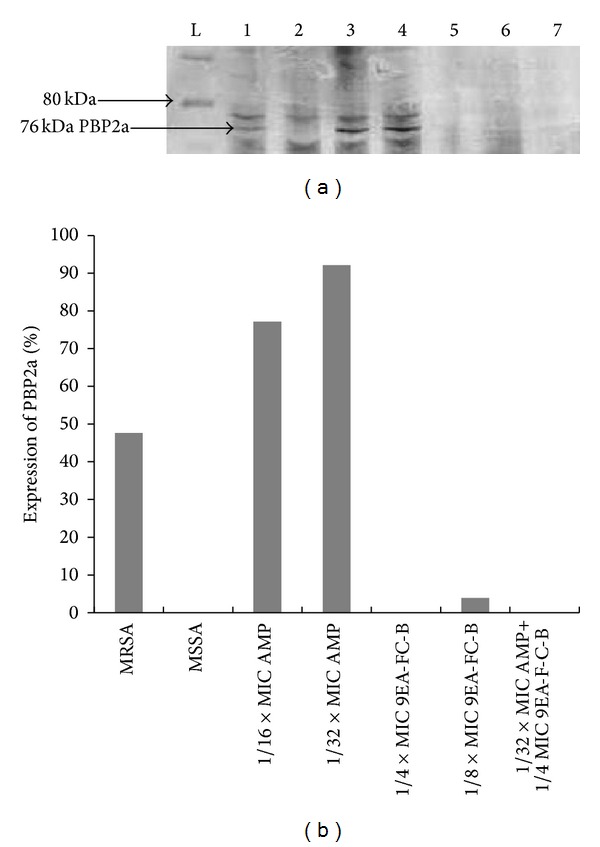
Figure 2.

Expression of penicillin-binding protein 2a (PBP2a) of MRSA cultures grown in the presence of subinhibitory concentrations of 9EA-FC-B and ampicillin. (a) Western blot image, lane, L; molecular mass markers, 1: control MRSA, 2: control MSSA, 3: 1/16 × MIC AMP, 4: 1/32 × MIC AMP, 5: 1/4 × MIC 9EA-FC-B, 6: 1/8 × MIC 9EA-FC-B, 7: 1/32 × MIC AMP + 1/4 × MIC 9EA-FC-B. (b) Quantitative densitometric analysis of PBP2a expression of MRSA cultures grown in the presence of ampicillin alone, 9EA-FC-B alone, and in combinations, normalized to GAPDH loading control. (AMP = ampicillin; MIC = minimum inhibitory concentrations).
