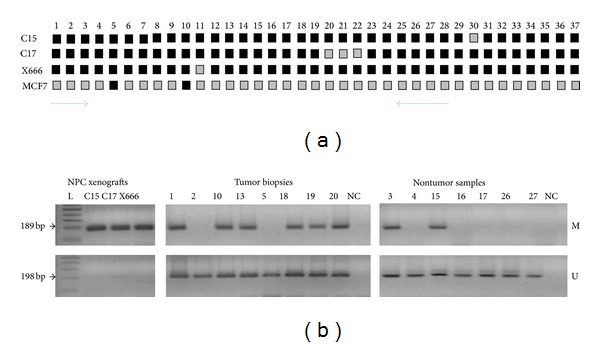
Figure 3.

(a) Sequencing results of 5-TTC40 gene from three NPC xenografts (C15, C17, and X666) and the MCF-7 breast cancer cell line. The methylation status of CpG is indicated by shading: black (methylated) and grey (partially methylated). The arrows indicate the position of primers used by MSP. (b) MSP results of 5′-TTC40 gene from the three NPC xenografts and the representative cases of tumor biopsies and nontumors samples. NC: negative control (sterile distilled water). M and U represent the amplification of methylated and unmethylated sequences, respectively. L: 100 bp DNA ladder.
