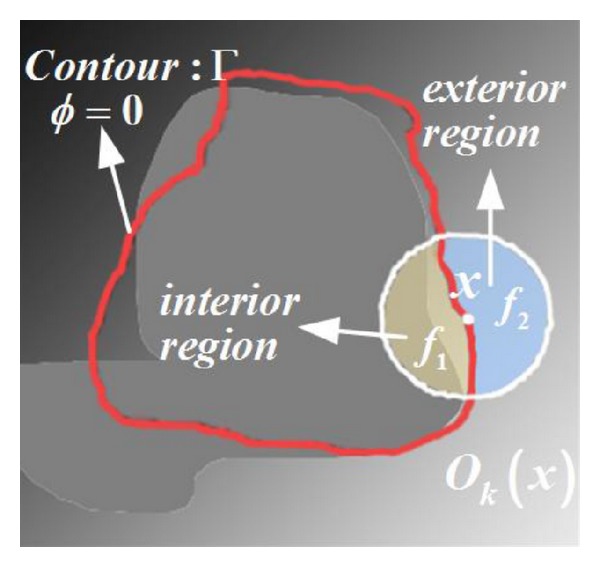
Figure 1.

Graphical representation of a local region O k(x). The white closed circle O k denotes the circular neighborhood of x. The red closed curve denotes the evolving contour (ϕ = 0). The mean intensities of the subregions {ϕ < 0}∩O k (yellow region) and {ϕ > 0}∩O k (blue region) are denoted by f in and f out, respectively.
