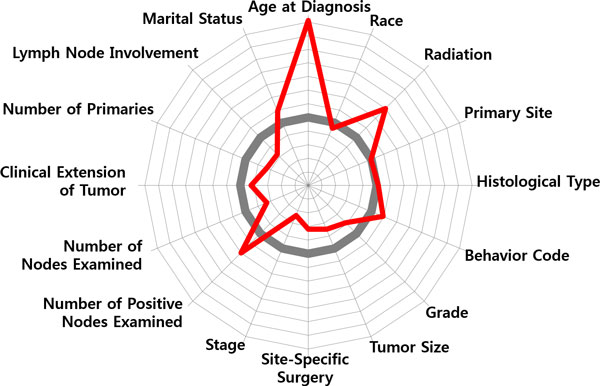
Figure 10.

Patient Segmentation: Feebleness of age. Patient Segmentation: Two radial diagrams in Figure 10 and 11 illustrate difference of patient segments in terms of patterns of prognosis factors.

Patient Segmentation: Feebleness of age. Patient Segmentation: Two radial diagrams in Figure 10 and 11 illustrate difference of patient segments in terms of patterns of prognosis factors.